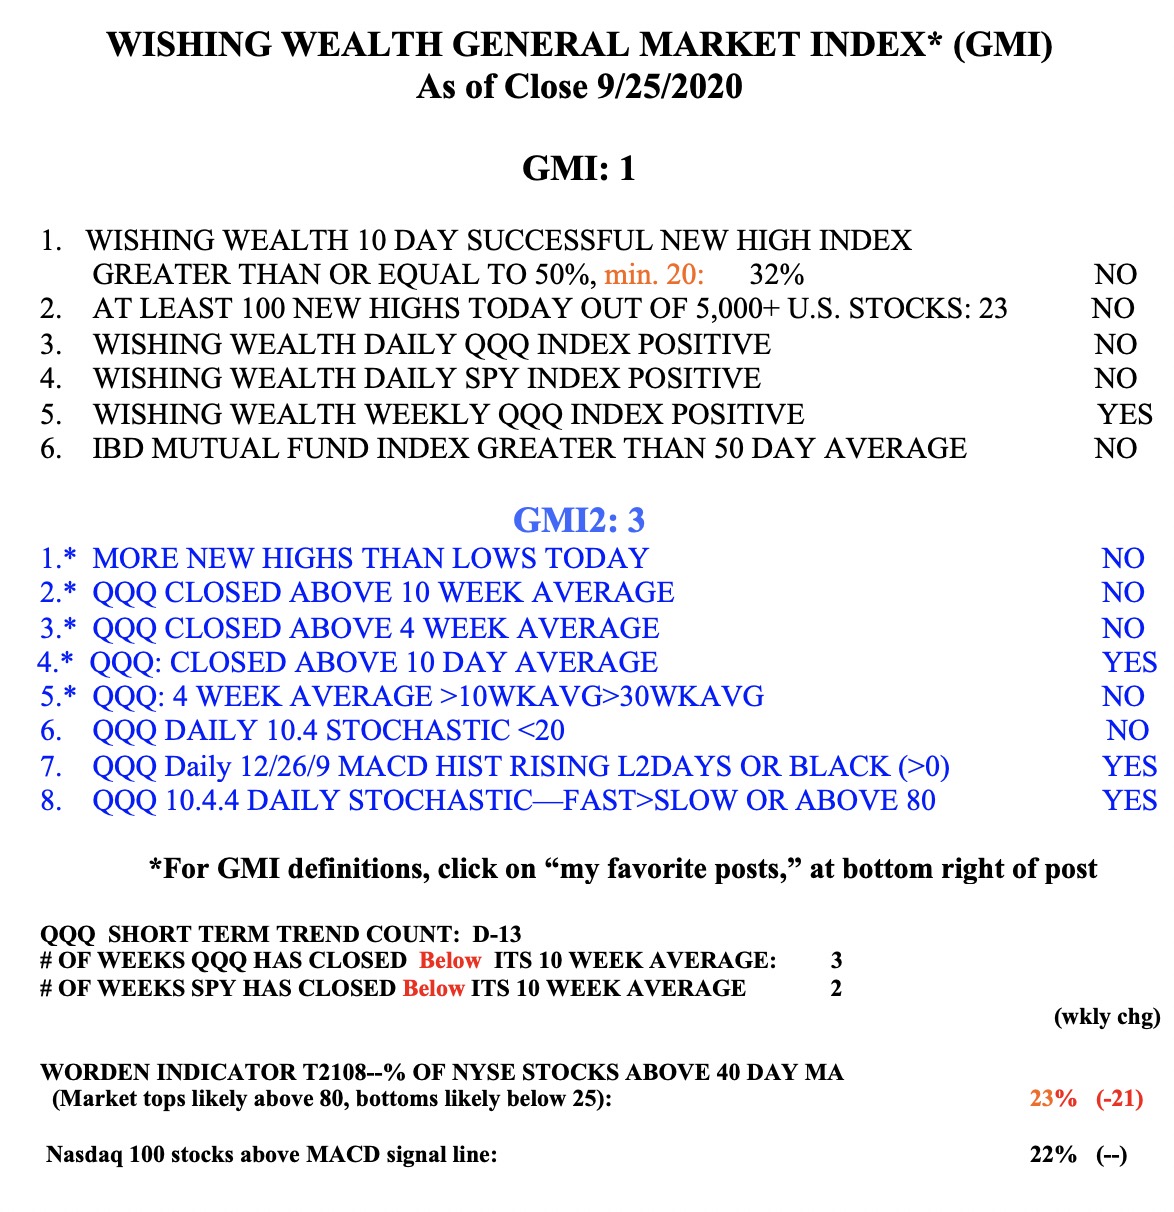
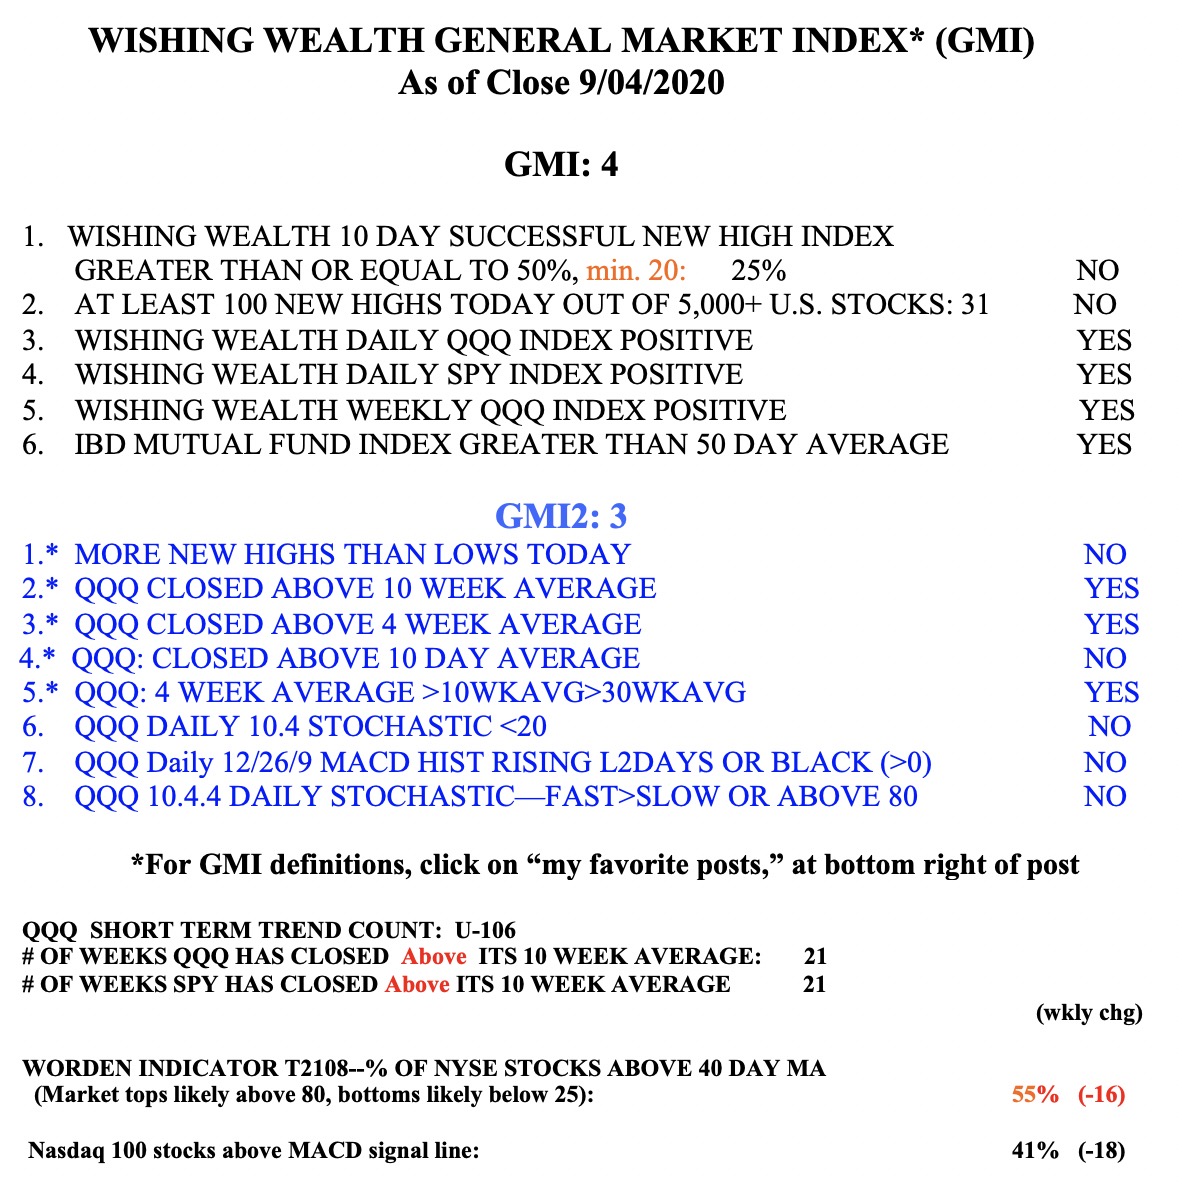
The GMI is 1 (of 6) and Red and IBD has called the market in a correction. IBD enthusiasts are looking for a follow-through day (FTD) this week. After a possible bottom, an FTD would occur if one of the major indexes were to close 1%+ higher on greater volume than the prior day. Investors.com and MarketSmith will tell us when an FTD happens. I am looking for a close of the QQQ back above its 10 week average (currently 273.13). QQQ has rebounded exactly to just below its 10 week average. Both the SPY and DIA are weaker and further below their 10 week averages. When the short term trends are down, it is more difficult to make profits by betting on the long side. You get shaken out repeatedly, at least I do.
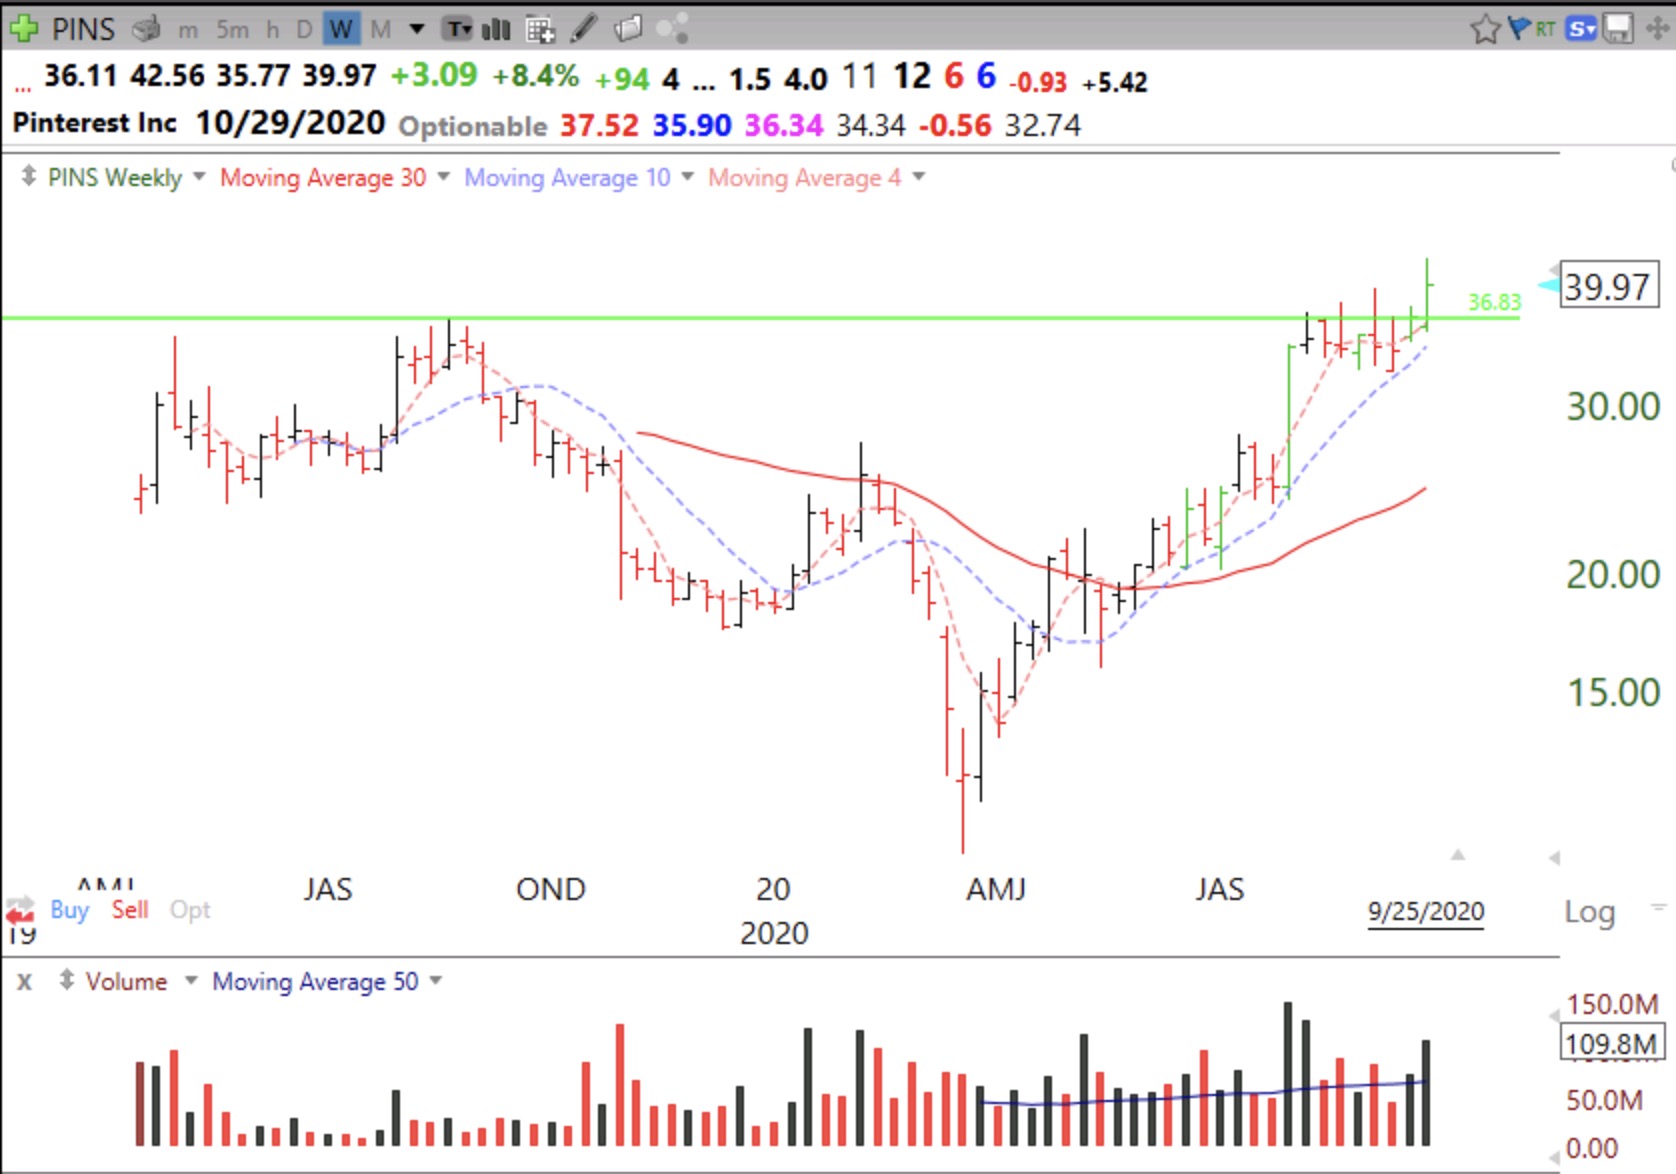
However, we know that market leaders are born during corrections. They build bases and even break out of bases to new highs sometimes, before the market turns up. Mark Minervini (@MarkMinervini) emphasizes this point often. I always watch the daily and weekly New High lists to look for promising stocks. A stock that has an above average volume break-out above its green line peak (GLB) to an all-time high is worth monitoring to see if it can hold above its green line. That is why I am watching $PINS, which had a beautiful GLB last week. $PINS is also a recent IPO, and has huge projected earnings for 2021 on MarketSmith, both promising characteristics of new leaders. PINS was one of the stock picks selected by the head of TickerMonkey, one of the speakers at Saturday’s extraordinary free online Boston IBD Meet-up. Also speaking at the event was the brilliant mathematician and stock analyst who writes @TMLTrader (TML=true market leader). His tweets are a wonderful source of promising stocks and he has partnered with TickerMonkey to offer a subscription to his TML portfolio picks.
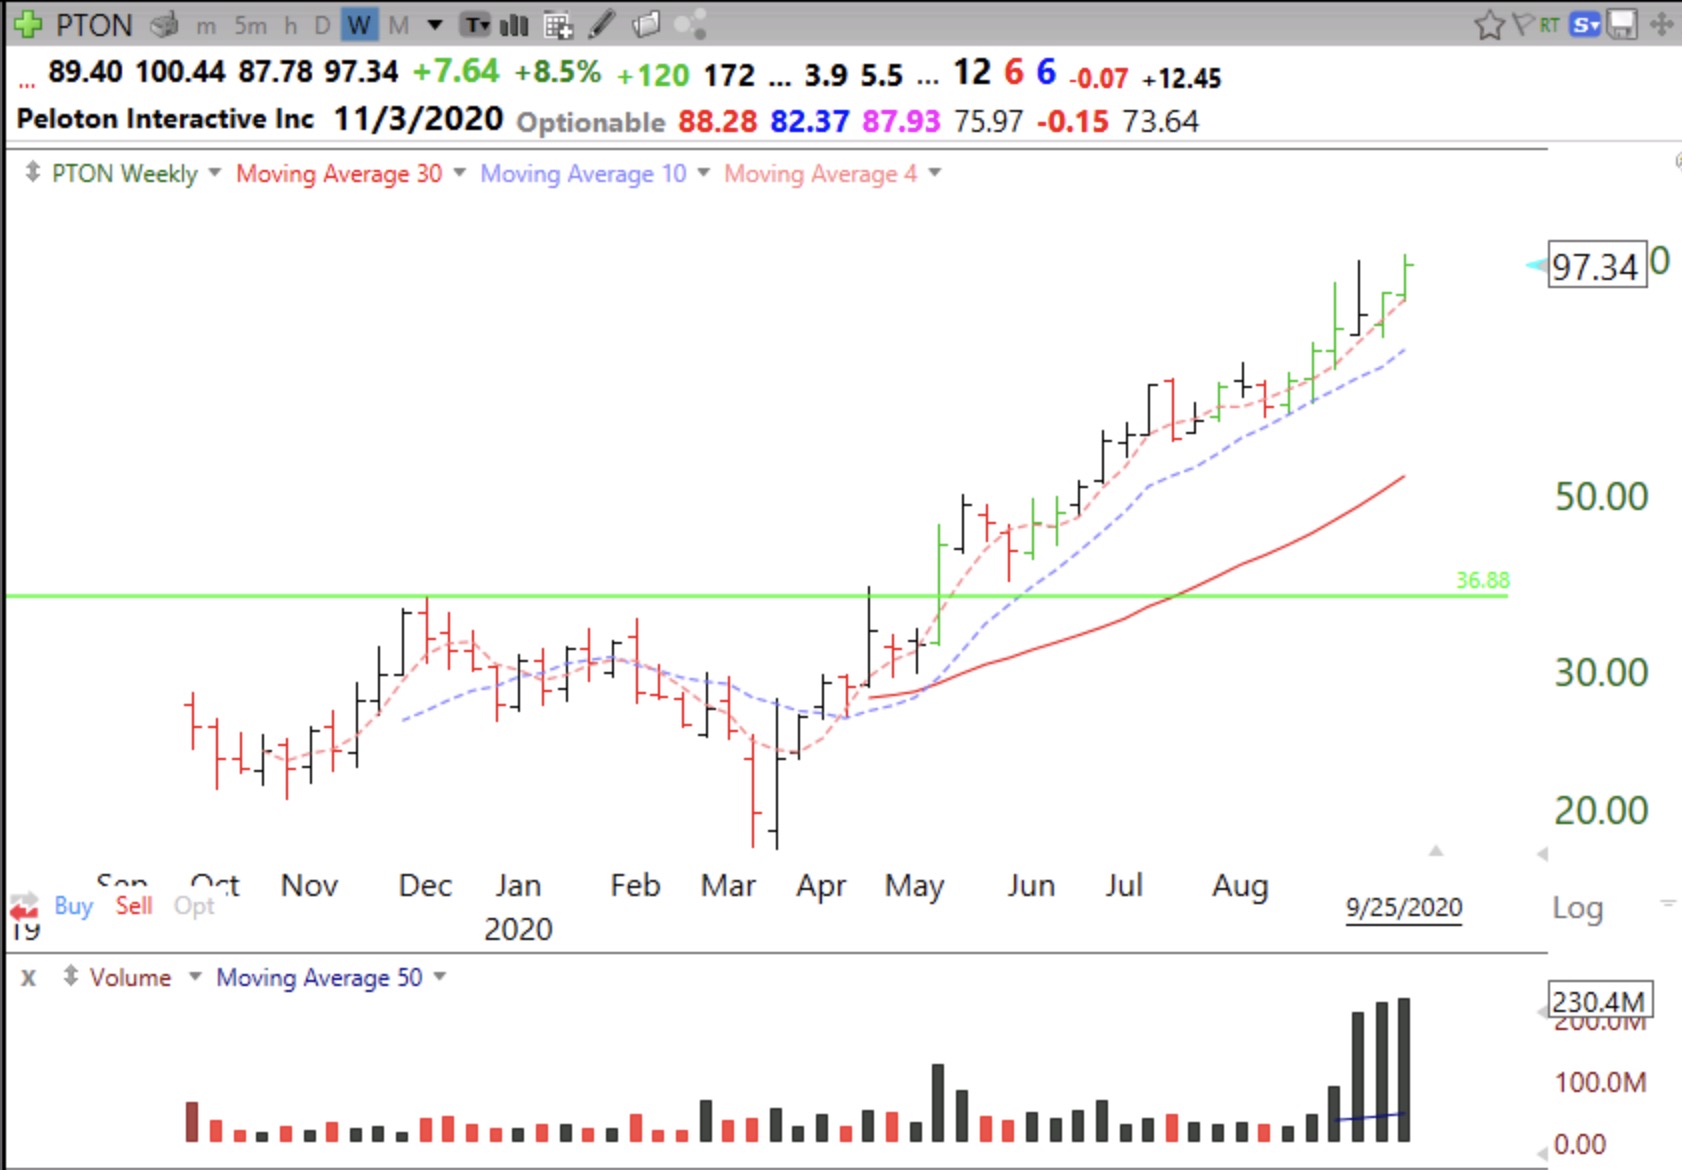
Look how $PTON has climbed after its high volume GLB in May. Note how it is climbing recently on above average weekly volume.
Once a GLB has occurred I sell if it closes back below its green line. Once it has proven itself and has moved above its green line, a good time to sell is when it closes below its 10 week average (blue dotted line). I find that focusing on daily charts often causes me to exit a winner too early. A rule I have posted on my screen: BEFORE SELLING, LOOK AT WEEKLY CHART.
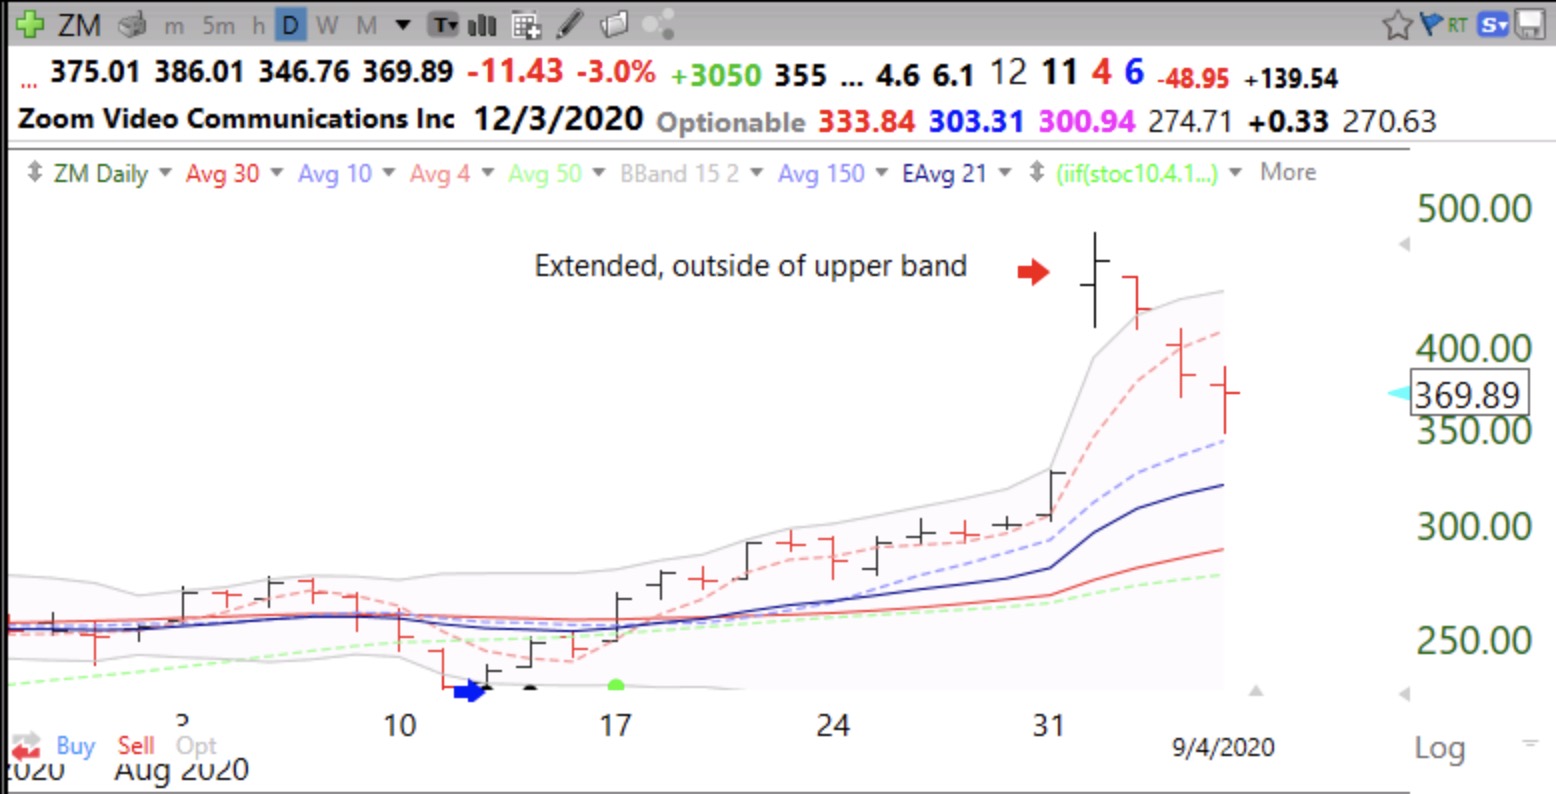
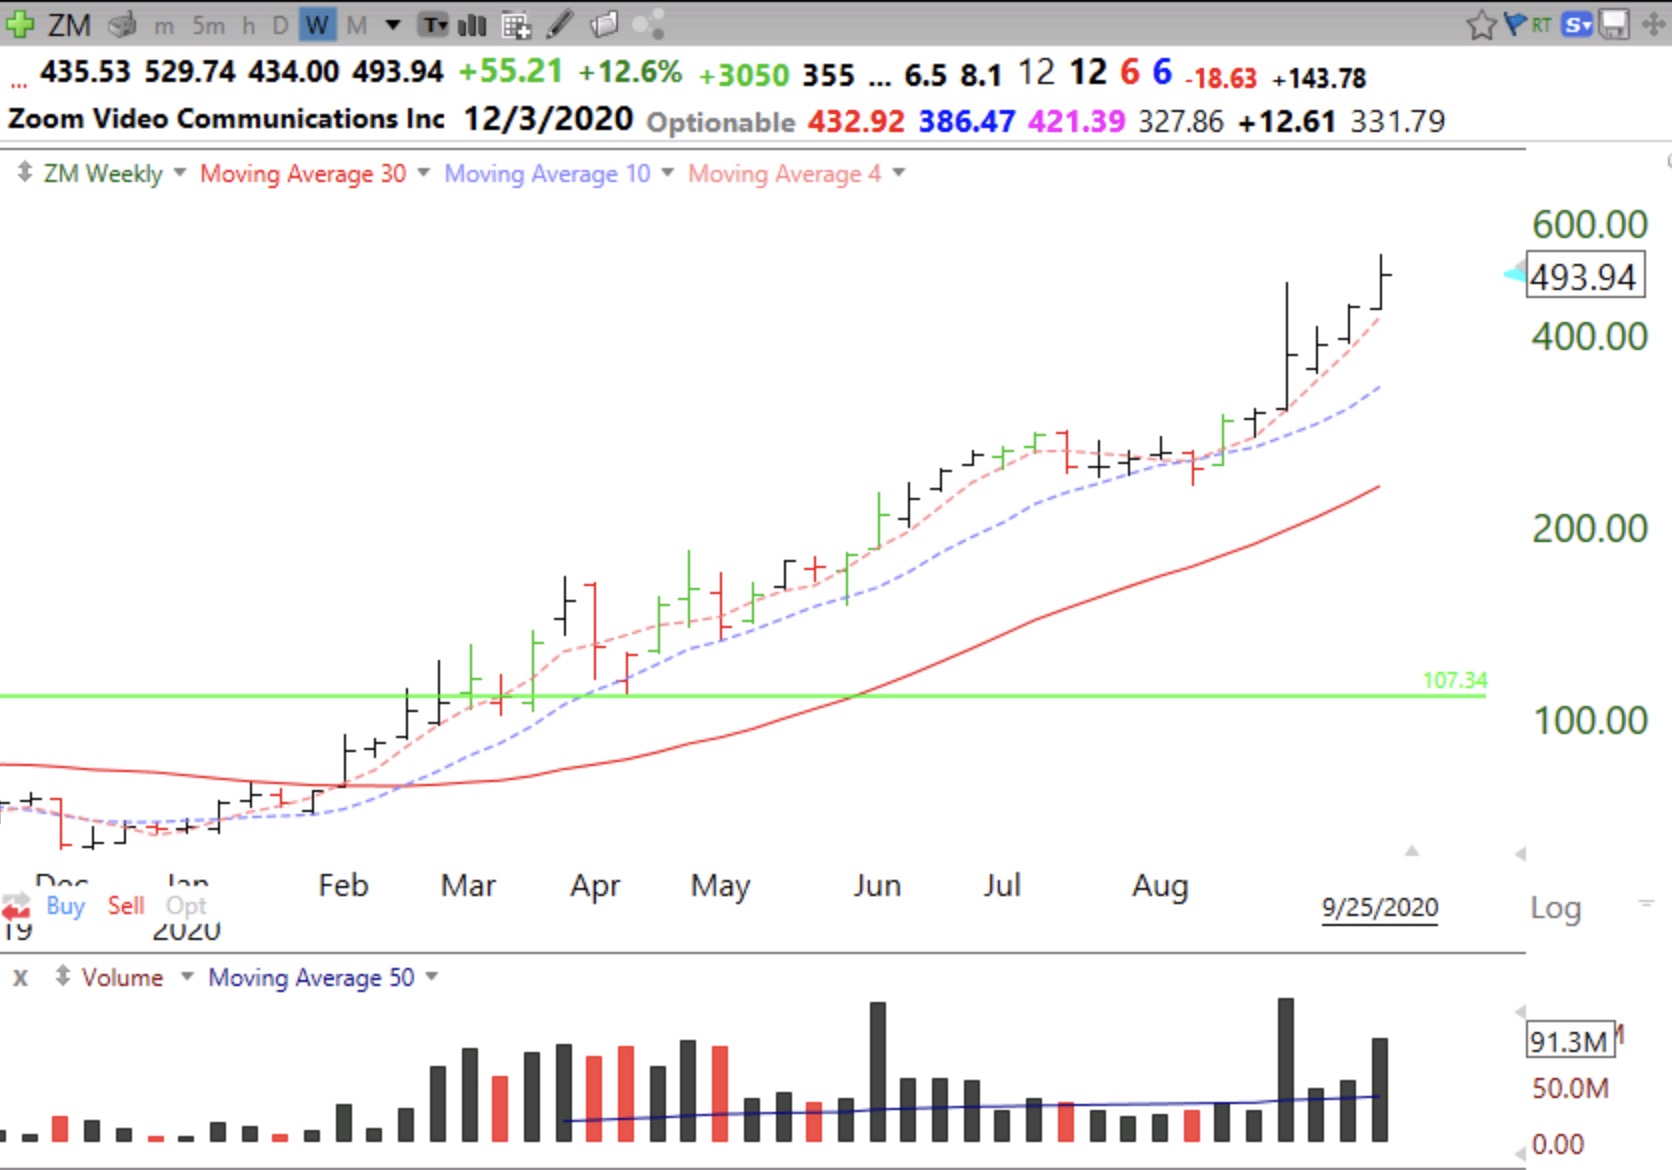
Look at the leader, $ZM. Only one weekly close below its 10 week, in August, since its GLB last March. Note the successful retest of the GLB in April. How easy it looks in 20/20 hindsight! Sometimes I think I should tune out everything (news, social media, opinions) and just program the computer to trade using a few simple rules.
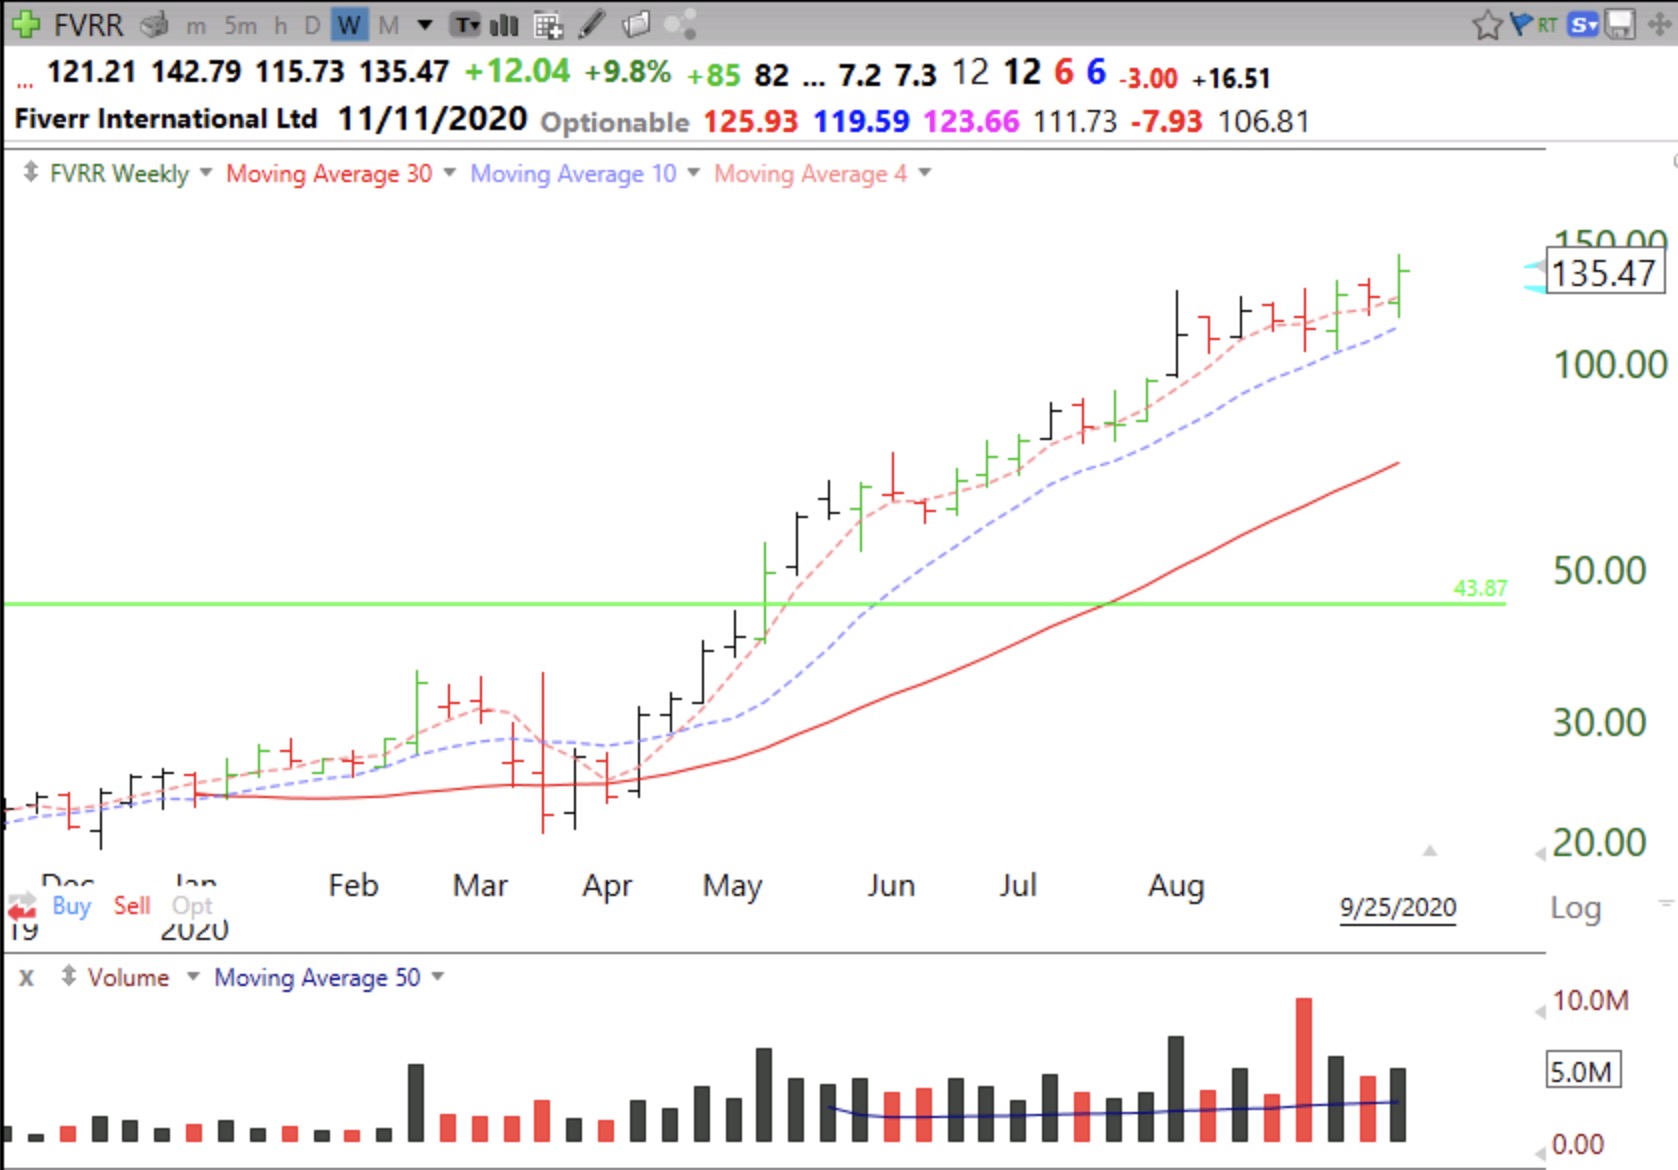
$FVRR has never closed below its 10 week after its GLB in May. (It surely will if I decide to buy it!)
The key for me is to buy rocket stocks soon after they have a GLB and to monitor them on a weekly chart.
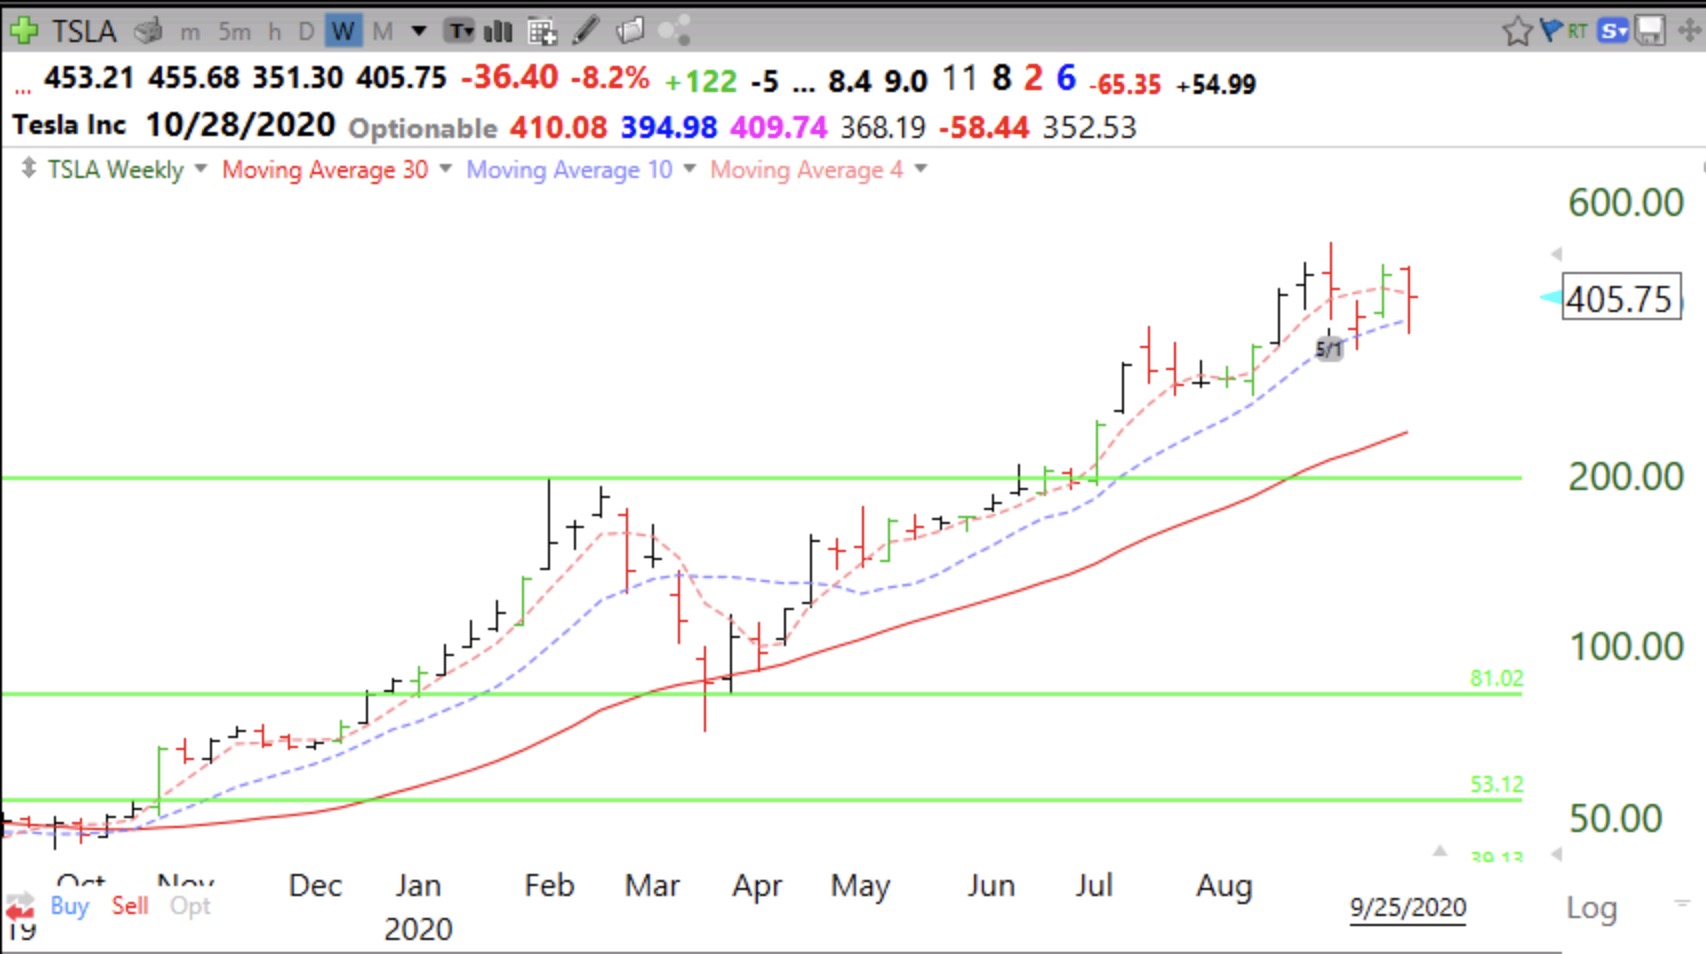
Other than 5 weeks during the COVID decline, TSLA has closed all weeks since November above its 10 week average. Note how often it closes above its 4 week average (red dotted line). If I use a strategy based on a weekly chart, I must wait until near the close on Friday afternoon to know whether a moving average will be violated. Many times the average is violated during the week only to close the week above it. Why is that? Do large buyers come in at the end of the week?
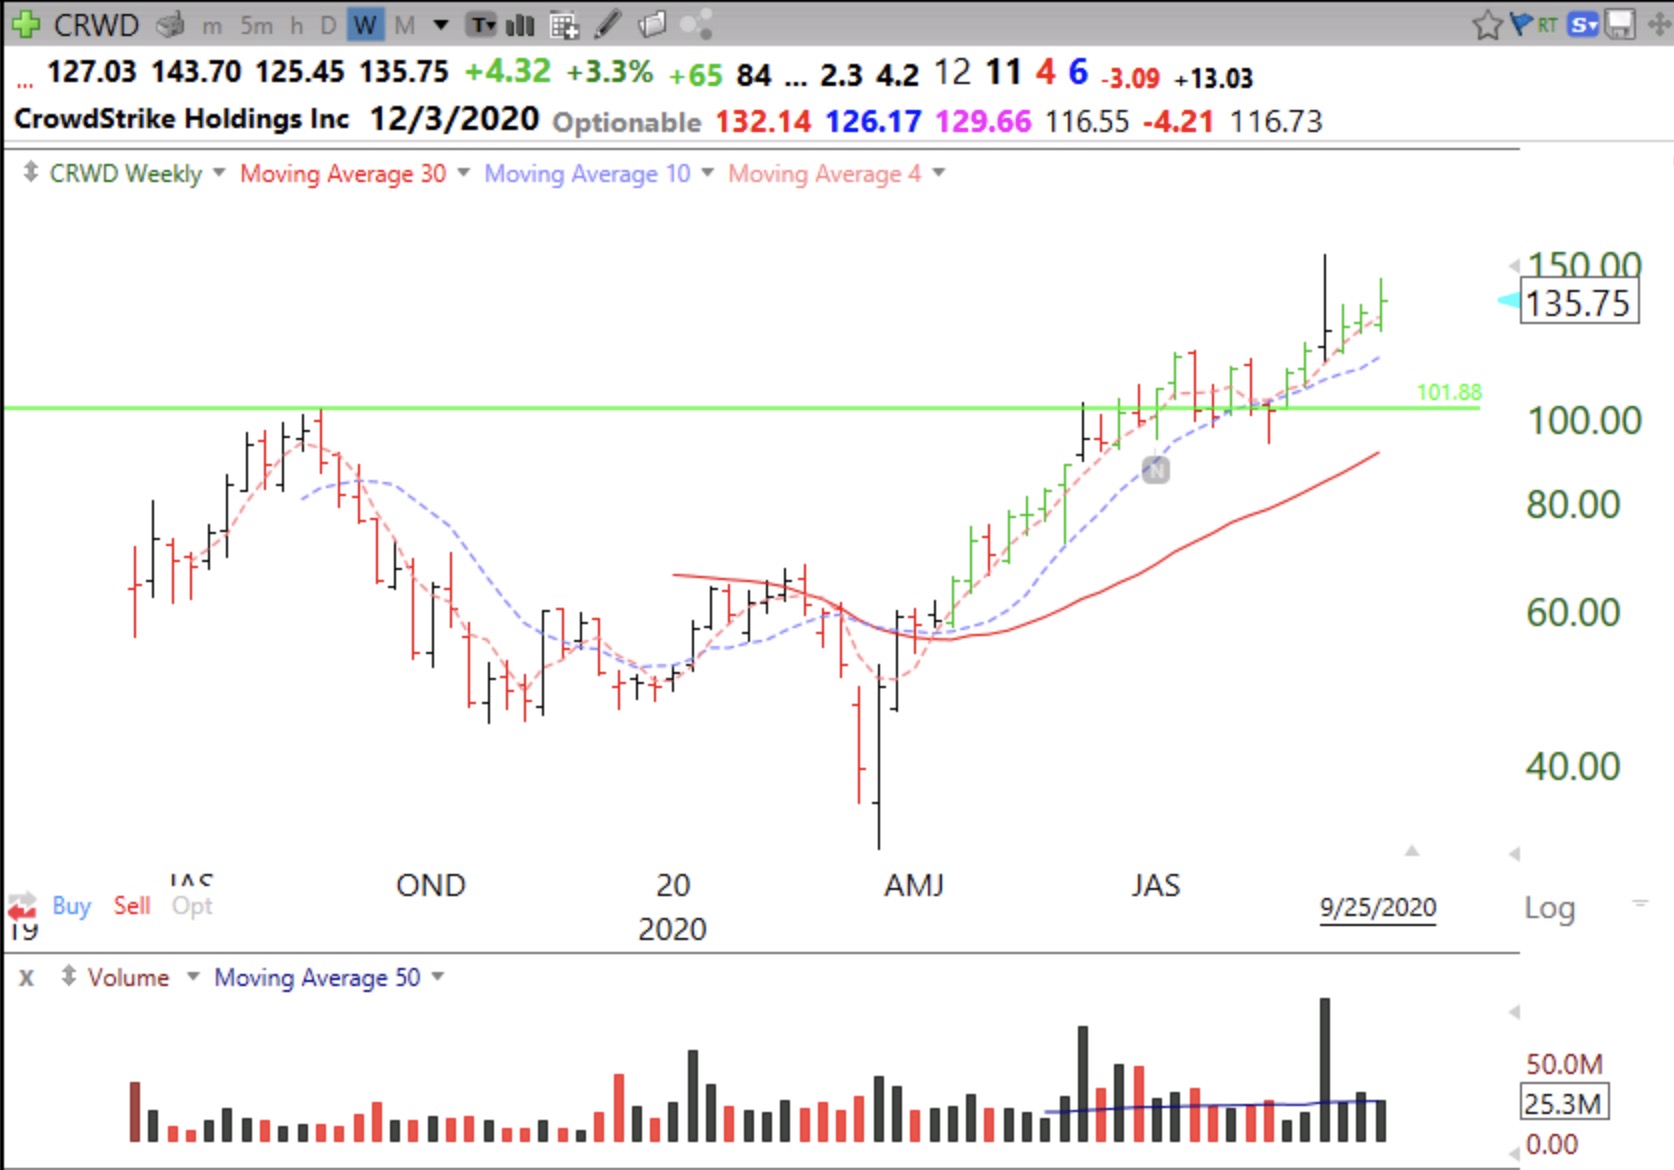
Here is a recent IPO that had a retest of its GLB. Will CRWD retake its ATH reached 4 weeks ago?
The GMI remans at 1 (of 6) and Red. With this market weakness as a background I am prone to selling out long positions at the first sign of any weakness. It is so much easier for me to trade profitably when the GMI is Green. T2108 reached a low of 13% last week but closed at 23%. When T2108 is below 10% it usually signals an extremely oversold market and a likely bottom. I always urge my students and never have the courage to do it, to buy some $SPY when the T2108 is in single digits. The depressing news and steep market decline at those times usually scare me from doing so.