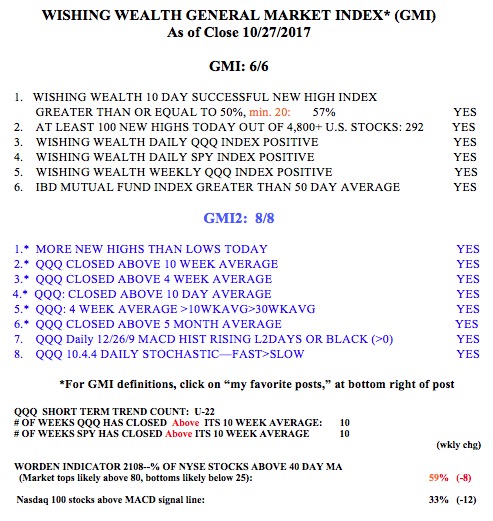
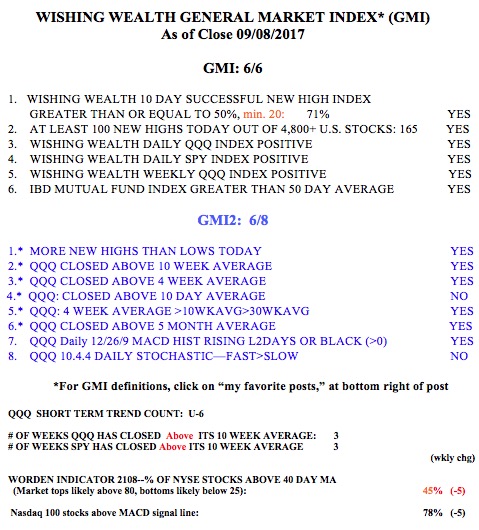
Over the past 50+ years that I have traded in the market, I have witnessed how Fed raised interest rates can kill a bull market. The risk from higher rates is extremely high now. This is because boomers, who are approaching retirement and own much of the wealth, would seize the opportunity to earn 3%+ on their money if it could be invested in relatively safe US treasury bonds. They will flee risky stocks in order to hang onto their portfolio gains achieved since 2009. So when the 10 year treasury bond, currently at 2.43%, gets to 3%, we should watch for signs of a market top as money is sucked out of stocks. The rush to the exits may result in a panic. (Right now, the GMI is strong and there are no signs of technical weakness, see table below.)
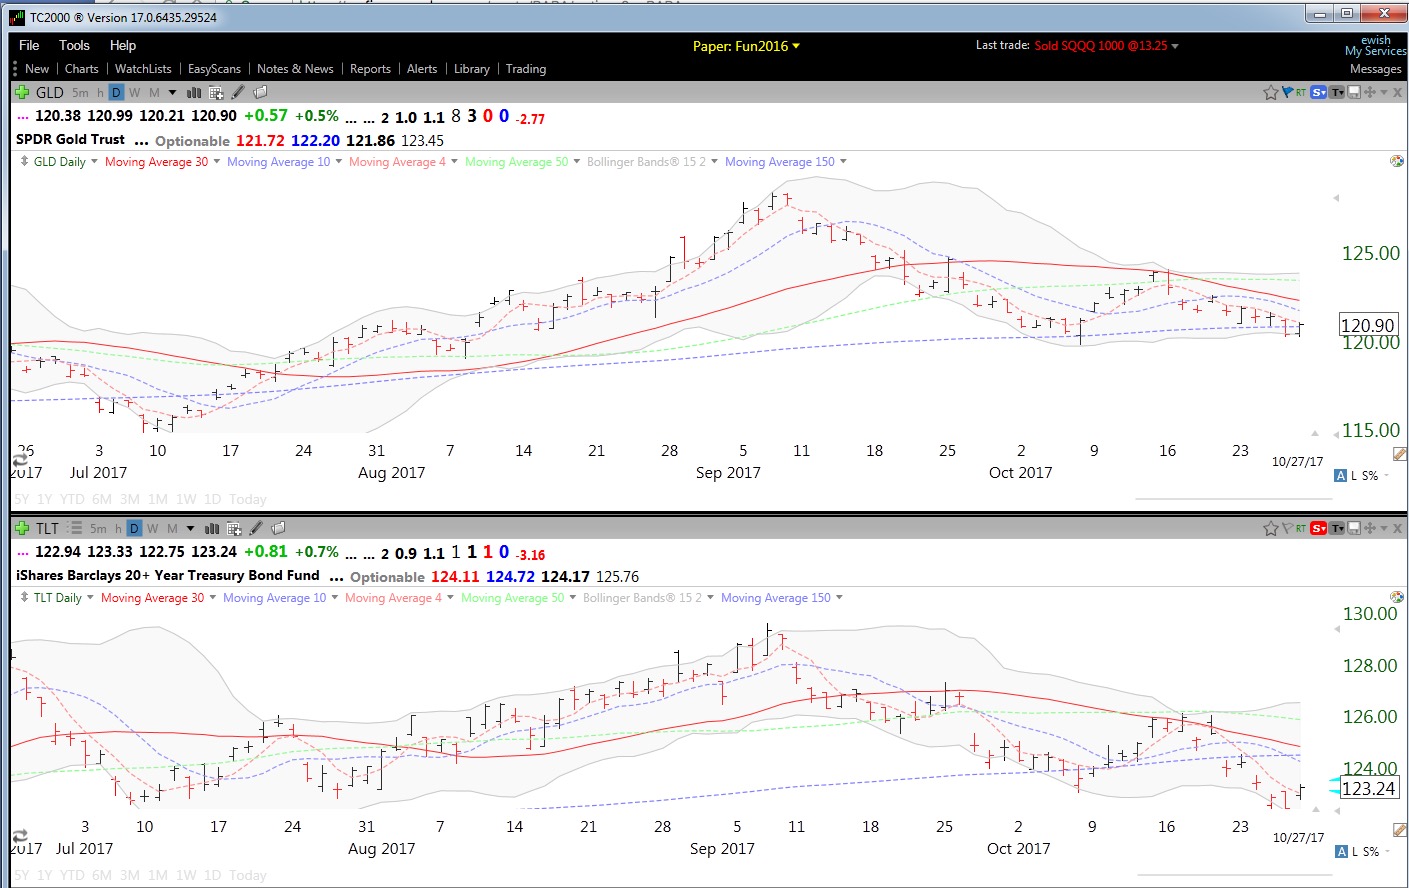
I therefore keep an eye on interest rates by monitoring the 20 year treasury bond ETF, TLT. As TLT falls, interest rates rise (Rate= Annual pay-out/TLT price), and the price of gold falls. This association occurs because international investors buy dollars with which to buy US bonds to earn the higher interest rates. As the dollar rises in value the price of gold falls (it takes fewer appreciated dollars to buy an ounce), barring a general rise in investor fear. The daily chart below clearly shows this correlation between TLT and GLD–it is difficult to tell them apart. Note that both have been falling since early September, reflecting a move to higher interest rates. (By the way, it looks to me like we may get a rebound in TLT and GLD from oversold readings this week as the Fed meets.)
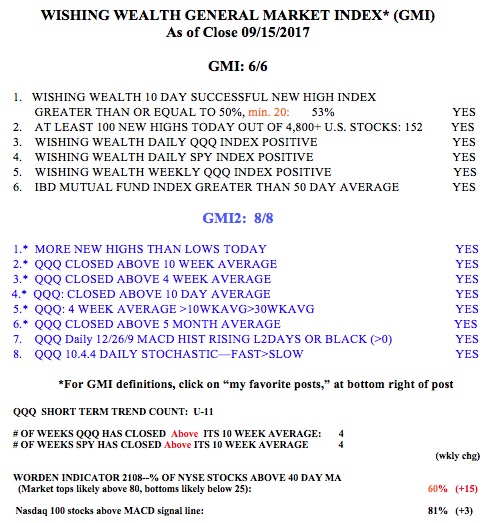
The GMI remains at 6 (of 6) and the GMI-2 is back to 8 (of 8). My conservative pension funds remain fully invested in mutual funds–for now. But I have seen some markets top early in the new year and it is currently opined that investors may be waiting to take gains in 2018 when tax rates could be lower than those in 2017. This strategy could create a rush to the exits in January…..