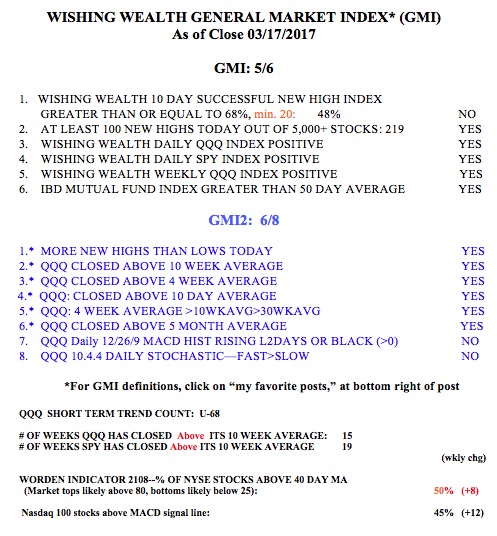
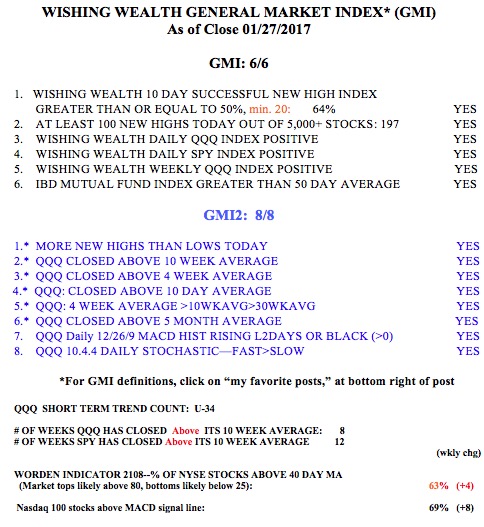
For many years I have been a fan of Stan Weinstein’s Stage Analysis (see his book on this page). That approach looks at a stock’s price compared to its 30 week moving average. A lot of analysts use this technique. My students all know to only buy or hold stocks that are above a rising 30 week average, or in a Weinstein Stage II. This is one of the six components I assess in my GMI (see table below).
Another approach I like to use is an adaptation of the 12 exponential moving averages that Australian technical analyst Daryl Guppy uses. His GMMA (Guppy multiple moving averages) plots the following weekly moving averages (six short averages 3,5,8,10,12,15 and 6 longer term averages 30,35,40,45,50,60).
I have developed a modified chart using the 12 exponential averages plus a simple average =1 which shows the close each period on the chart. The six shorter averages are red and the six longer term averages are blue. The dotted line on the chart is the close each period. The background is always white. The period depends on the time period of the chart shown.
I have been using the weekly charts to show a RWB (red/white/blue) up-trend when the red averages are rising above the rising blue averages such that there is a white space between them. A BWR down-trend is simply the reverse pattern.
I recently came to the conclusion that the weekly chart is good for showing the longer term trend but not very useful for timing entries and exits. It just takes too long for the weekly averages to show a change in trend. I have therefore decided to focus mainly on RWB daily charts. I also added a plot of the new single day average of the daily lows to show the low price of the equity each day (purple dots). These dots can aid in visualizing support and where to place stops.
This daily chart helps me to immediately determine the short term trend. An advancing equity will have a RWB pattern with the daily price (dotted line) above all 12 lines and leading all of the shorter term (red averages) averages higher. I now compute and show on each chart a count of the number of red averages that the equity is above (RLC or red line count). Thus an advancing equity will have a maximum value of 6 of 6. A value of 0 means the equity is below all of the red averages. This is a signal to me for caution. As long as the stock remains in an RWB pattern it is still advancing, but if the RLC is 0 I might raise my stop. I would definitely sell out my position if the red lines converge with the blue lines so that the white space between them disappears.
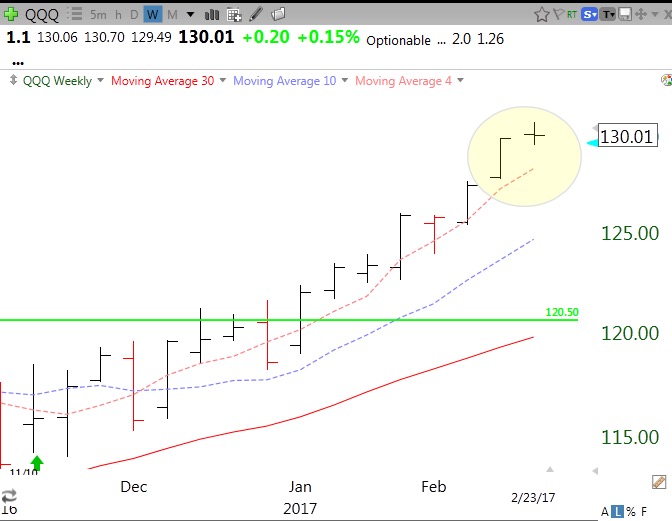
It is much easier to demonstrate the above description with an equity. Here is the daily chart of QQQ.
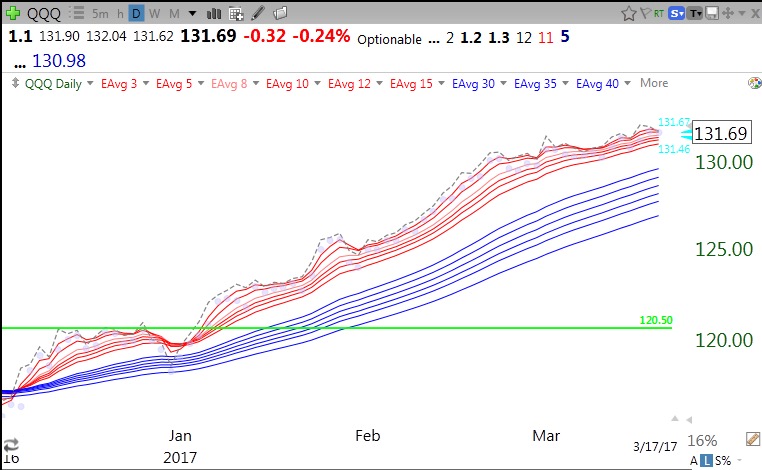
The QQQ has been in an RWB up-trend since last December. There was one day, December 30, when the QQQ closed below its red lines and entered the blue lines. But the RWB pattern never disappeared. For most of the days since then the QQQ (dotted line) closed above all of the red lines. As of Friday, the QQQ closed above only 5 of the 6 red lines. Note the 5 at the end of the top line of my chart. This is the red line count (RLC). What caught my attention was this daily chart of the SPY.
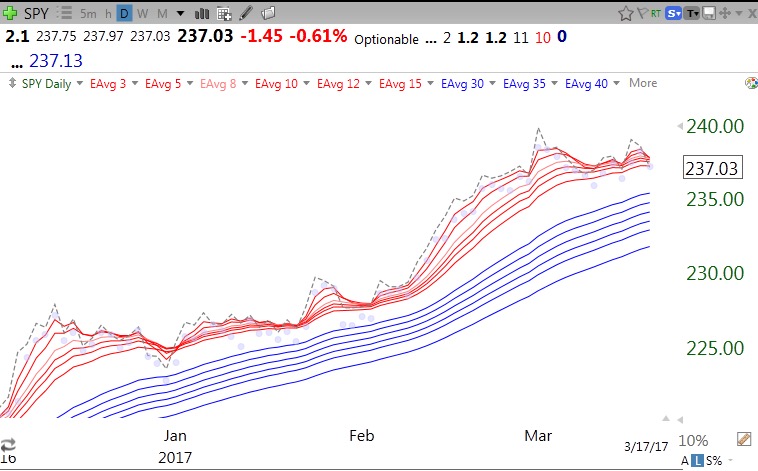
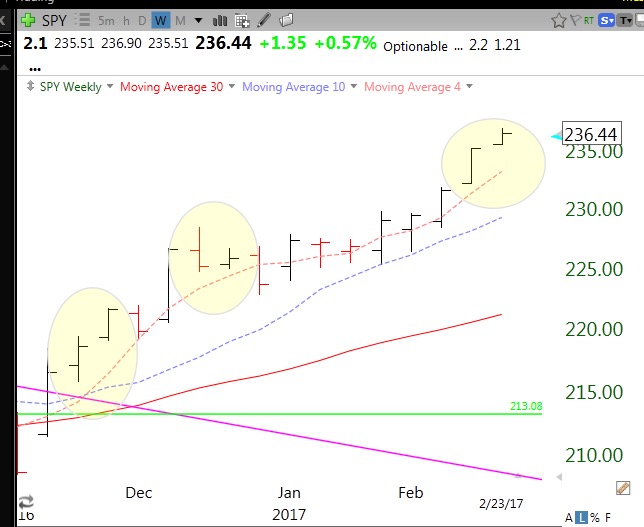
The RLC=0 for the SPY! While this is not a huge sign of weakness, it is the first time it has happened since January. In those cases the SPY rebounded right away. Will it do so on Monday? The RLC=2 for the DIA and is also showing an RLC rarely seen since this rally began. What really concerned me was this chart of the Dow Jones Transportation Average.
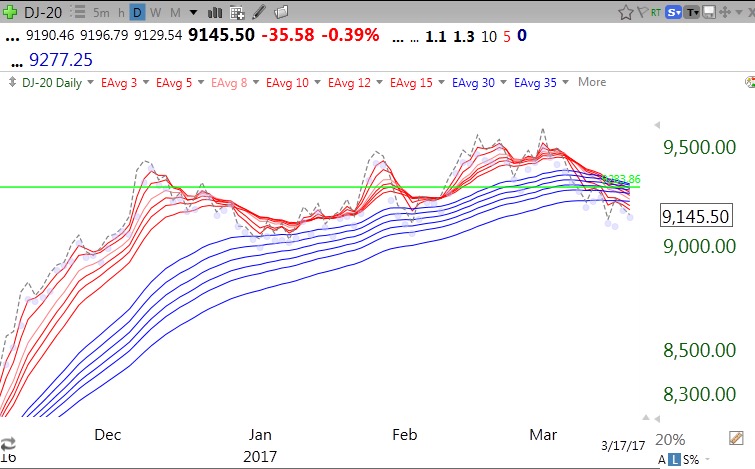
Not only is the RLC=0 but the RWB pattern is totally gone and the DJ-20 has now closed below all of the red and blue averages. This may be significant because one classic way of sizing up the market trend is the Dow Theory, which uses the Industrial and Transportation Indexes. A strong economy and market should show up in strong rails and airlines….
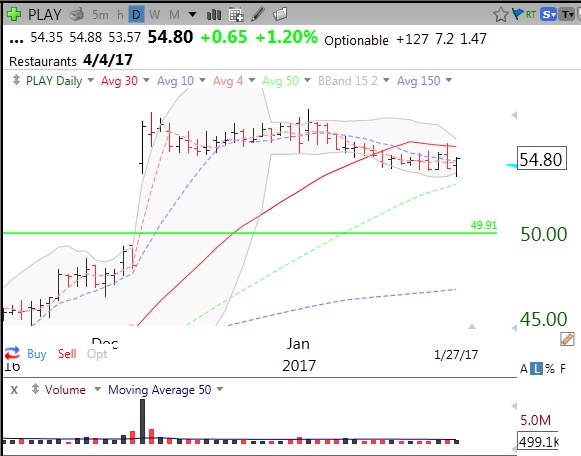
I also find the daily RWB charts very useful for analyzing individual stocks. I use TC2000 to scan for stocks in a steady RWB daily up-trend that have recently been oversold. The RWB chart shows me where I might place my sell stop if I make a purchase. I either want to sell if the stock returns below the lowest rising red line (which will be the 15 day exponential moving average) or if it breaks recent support. I can find these levels easily by looking at the pattern of daily lows (purple dots) or the values of the 15 day exponential average which appears on the second line of each chart in large digits. Here is an example of a stock that came up in my scan for daily RWB stocks that have been oversold and resumed their advance. This is not a recommendation for purchase and is for illustrative purposes only.
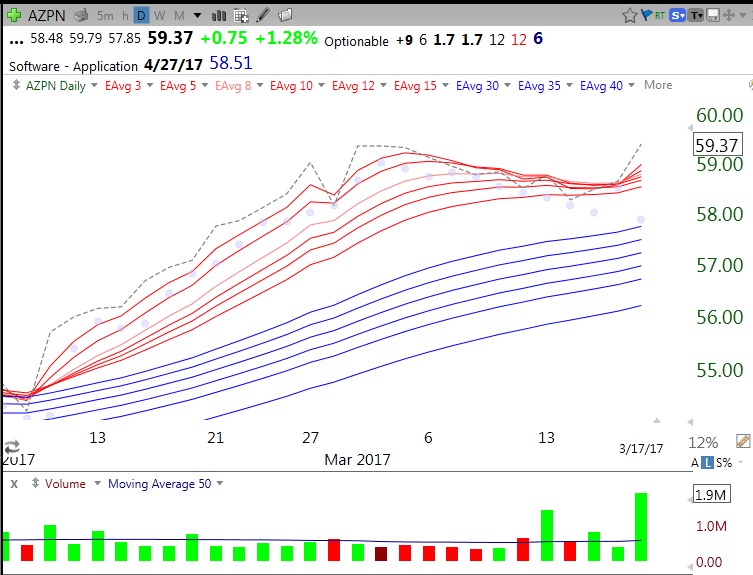
AZPN is a strong stock (up 70% this year) that is in an RWB pattern. The RLC=6, indicating that AZPN has closed back above all of its red lines. The value of its lowest red line is 58.51 (second line, big digits after next earnings date) and a conservative place for a sell stop might be just below this level. AZPN has rarely closed below all of its red lines. However, the purple dots show that the daily lows of AZPN have recently been below all of the red lines. This is to be expected because this scan looks for stocks that were recently oversold (low stochastics). So a more liberal stop might be below its lowest recent daily low, somewhat less than 58. Note also the above average trading volume on Friday’s rise. One thing I do not like about AZPN is its low recent quarterly earnings, up only +9%.
I like this scan a lot. But I suspect that if the averages rest over the next few days, these set-ups will fail. We are approaching the end of first quarter period. Often times there is a brief decline that sets-up end of quarter window dressing by the mutual funds. So I am watching very carefully this week while I am out on spring break.
I ran this scan on my list of stocks that have hit an all-time high since I started informally aggregating them this year. The scan identified 59 stocks. If you want to run this scan, go to my TC2000 Club and access the scan from 03182017. This scan is further described in the glossary to this blog page. Let me know if it works well for you, please.
The GMI is at 5 (of 6) and the GMI-2 is 6 (of 8), but note that the two negative components in the GMI-2 (stochastics and MACD) are the most sensitive ones and the first to weaken if the QQQ is ending its up-trend. My up-trend count is now U-68, closing in on the longest short term up-trend since 2006 (88 days).