Why search for individual stocks when we can ride the ultra ETF’s?

GMI4/6
GMI-R8/10
T210886%

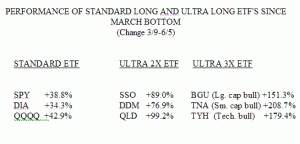
It is rare that I complete an analysis whose findings totally surprise me, but take a look at this one.   A lot of the pundits claim that the ultra ETF’s,   leveraged baskets of stocks that try to double or triple the performance of their underlying indexes or sectors, fail to achieve their goals.   So, just to satisfy my curiosity, I compared the performance of the primary index ETF’s, SPY (S&P500) , DIA (Dow 30)   and QQQQ (Nasdaq 100) with those of the leveraged ETF’s.   There were exact comparisons for these indexes for   the 2X ETF’s, but I had to choose other, more general   indexes for the 3X ETF’s. The results blew me away…

The 2X and 3X Ultra ETF’s absolutely outperformed the standard index ETF’s in the period since the March bottom.   For example, while the QQQQ (Nasdax 100) index ETF rose 42.9% in this period, the QLD (2x QQQQ ETF) rose 99.2% and the TYH (technology bull 3X ETF) rose 179.4%.   In comparison, the top five individual stock performers in the Nasdaq 100 stocks rose from 138.8% (JAVA) to 180.57% ( STX).   In fact, only 16 stocks (16%) in the Nasdaq100 (and 23% in the S&P500) rose 80% or more.   So, the choice before us is to   search for the needle in the ultraetfperohaystack individual stock that might do really well in a bull rise, or to buy one of these 2X or 3X ultra long ETF’s and ride a basket of stocks with a lot more diversification and probably less risk than owning individual stocks.   The key is to discern the trend accurately and to then ride the ultra ETF with the most potential for following that trend.   Some ultra ETF’s also trade options…..
Read more

Comparison of Current Bear to Bear Markets of 1929, 1973-74, 1987 suggests Dow 3,500 possible

GMI0/6
GMI-R0/10
T210813%

I am getting tired of listening to all of the pundits saying that the current decline resembles the 1974 bear or the 1987 bear markets.   How about looking at some data!   So, I used my TC2007 market price history database to compute how much the Dow Jones Industrial average declined in prior bear markets after the market’s peak.

The results, presented in the table below, are quite revealing and unsettling if one is looking for a near term bottom.   I would be interested to learn if you agree with my analysis.

Twenty days after the Dow had peaked, the Dow   was down 7-10% in each of these beginning bear markets. By 40 days post Dow peak, the 1987 decline had already bottomed out (-41% by day 39) and rebounded to -26%.   The ferocity of the 1929 bear was evident early on, showing a 40% decline by day 40.   In comparison, the 1973 and 2007 bears appear puny, registering only 4% to 8% declines by day 40.   The 1973 and 2007 bears tracked each other quite closely until 260 days post the Dow peak.   By day 260, the 2007 bear was actually showing a greater than the decline that started in 1929 (-40% vs. -38%) and was more than twice the decline shown in the 1973 bear market (-17%). Since day 260,   the current bear market has resembled the 1929 bear market closely, with declines being about 14 percentage points smaller.   I would conclude then, that the current bear market is tracking much closer to the one that began in 1929 than to the 1973 and 1987 bears.

Read more

Nicolas Darvas trading techniques require markets at all-time peaks

The basic principles of my method are in fact quite simple:

Firstly, except in exceptional cases I only buy the stock of companies in new or developing industries, i.e., companies whose growth and earnings prospects look highly promising.   I never buy stocks in established industries, in companies with huge capitalizations, or in companies which are already so big that the prospect of substantial growth is highly unlikely.

Secondly, having found such lively stocks, I certainly do not buy them straightaway.   I first check the overall market trend to ascertain whether stocks in general are in an uptrend.   I then check whether the stock belongs to a strong industry group, i.e., a group that is performing well in the market relative to other groups. Only when I have satisfied myself on these two points do I look in more detail at the stock that interests me.

Why all these precautions?   Because I like to be sure that the odds are in my favor.   If the market is in a downtrend, and the industry group is performing weakly I know that the cards are stacked against me and that my chances of making big profits are poorer than if the market and the industry are strong.   You cannot be too careful in the stock market.

Read more