Where are we in the market cycle? Riding the up-trend.

GMI6/6
GMI-R10/10
T210863%

I used my favorite indicators to review the Dow 30 Index’s action since 1915, as this is how far back TC2007 allows me to track this index.   I looked at the monthly chart and the following indicators: 5 and 30 month simple moving averages and the 25.4.4 monthly stochastic. I am posting a chart of the Dow 30 since late 1992. A few patterns leap out at me.   First, notice how the Dow spent most of the time in the roaring 90’s   up-trend above the rising 30 month moving average (red line) and with the 5 month average (dotted line) rising above the 30 month average.   
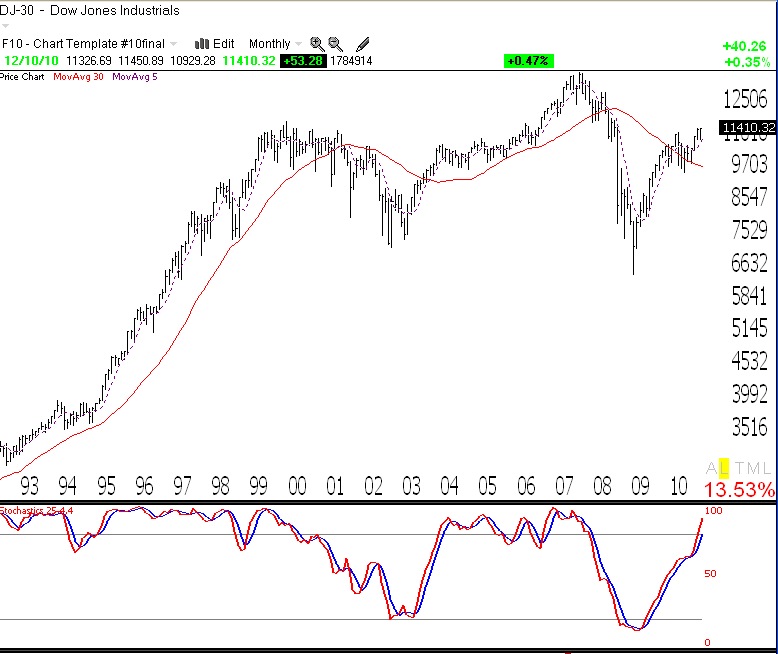
(Click on chart to enlarge.) The stochastic (in the lower window) with two exceptions, spent almost all of the time above the 80% “overbought” level (top parallel line), until it began a steady decline in 1999, foreshadowing the major decline in the Dow. The 5 month average declined below the 30 month average. The bear market bottomed out with the Dow below the declining 30 month average and with the stochastic around oversold territory, near 20% (bottom parallel line). The market turned up, the 5 month average rose above the 30 month average and the stochastic returned to near 80% again.   In 2008, the process repeated itself, with the 5 month turning down below the 30 month average and the stochastic declining until it became very oversold again, around 20%.   The market has now rebounded, the 5 month average is rising nicely above the 30 month average and the stochastic has just returned to overbought territory, an area where it has stayed for years in some previous rising markets.

So where are we in the current cycle?   It looks like we are in a strong up-trend with no sign of any weakening yet.   In fact, the 30 month average has not yet reversed up, but the 5 month average is moving up nicely above it.   Now I have learned in trading   over the past 40 years that patterns are meant to be broken.   The road is littered with the carcasses of Ph.D.’s who wagered heavily and lost, based upon complicated mathematical relationships that worked in the past.   I can tell you that the simple patterns I have discussed below seem to me to have worked well over the past 95 years.   Major bottoms in the Dow have occurred with this stochastic below 50% and the more severe ones, around 20%.   So, I won’t begin to suspect the end of the current up-trend until I see the stochastic turn down and the 5 month average decline below the 30 month average. I’ll let you   know when that happens…….

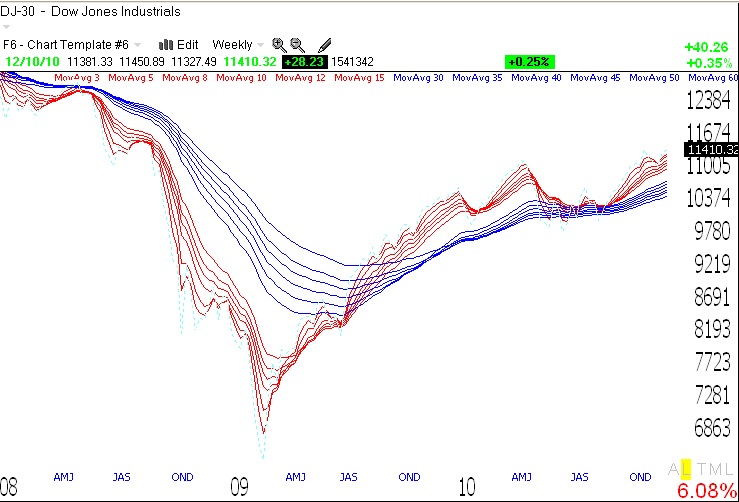
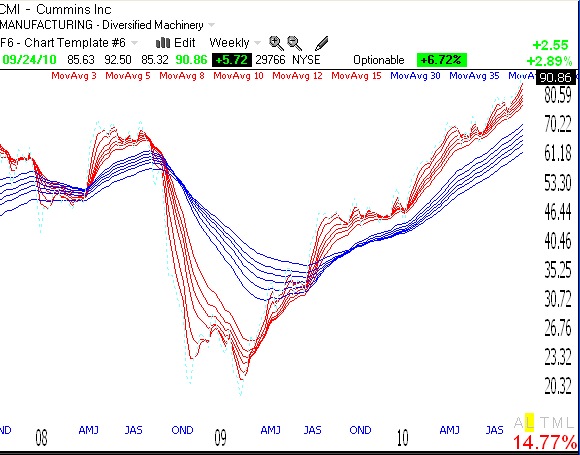
Meanwhile, my General Market Indicator (GMI) remains at the maximum reading (6 of 6) and the more sensitive GMI-R is at 10 (of 10). 
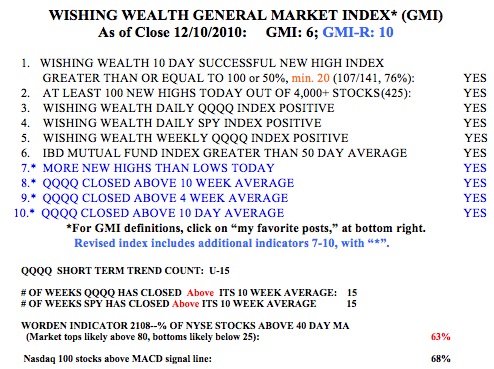
Thus, all of my short term and longer term indicators for the   QQQQ (Nadaq 100 tech stocks), and the SPY (S&P 500 stocks) remain positive. The QQQQ and SPY have closed above their critical 10 week averages for 15 straight weeks. However, Friday was only the 15th day of the QQQQ short term up-trend.   The Worden T2108 Indicator is at 63%, in neutral territory. And 68% of the Nasdaq 100 stocks closed with their MACD above its signal line, a sign of short term strength. The weekly GMMA chart below shows that all of the short term averages (red) are above the rising longer term averages (blue), reflecting an established up-trend. So with my more conservative funds, I am adding to my positions in the major index ETF’s like QLD, SPY and DIA, a comfortable way for me to ride the up-trend.

Introducing Red White and Blue (RWB) Stocks–The Pattern of Rockets

GMI6/6
GMI-R10/10
T210882%

I identified the beginning of the new QQQQ short term up-trend on September 7th.   The GMI on that day registered   5 (of 6).   One of the lessons I learned from the great Nicolas Darvas is to use one’s own judgment and to insulate oneself from the news, media pundits and other traders.   He learned this lesson when he returned to NYC after making a lot of money trading while he danced around the world, only to find that he lost his objectivity and his ability to trade profitably   when he was in NYC around other traders.   By definition, when a new up-trend is beginning, most people will be expecting a continuation of the current down-trend or flat pattern.   In early September, when the GMI was flashing a buy signal, most people were talking about a double dip or head and shoulders top.   The key to being on the right side of the market is to observe closely what the market is doing.   I therefore fly on instrument and tune out everything else. Remember, Darvas used to get Barron’s in the mail and proceed to rip out all of the pages except the stock quotations.

And so the GMI remains at 6 (of 6) and the GMI-R at 10 (of 10).   The SPY and QQQQ have closed above their critical 10 week averages for four weeks.   The QQQQ completed the 14th day of its current short term up-trend on Friday. The Worden T2108 remains over 80%, which is near overbought levels, but it reached 89% in August, 2009. A high reading of the T2108 is not as predictive as an extremely low reading, below 10%.   82% of the Nasdaq 100 stocks had their MACD above its signal line, down from 94% last Friday. This indicator bears watching, because it is very sensitive to the short term trend. Note that buying stocks at new highs has been a promising strategy lately, with 71% of the stocks in my universe that hit a new high 10 days ago, closing higher on Friday than they did 10 days earlier (see the Wishing Wealth   Successful New High Index in this table). Most of the stocks listed on the lower right of my site have been powering ahead to new all-time highs.   I never can understand why most people who want to own a rocket, refuse to buy stocks trading at highs.   A rocket on the way to the moon has to hit many daily new highs along the way……

Speaking of rockets, I have coined the term Red White and Blue as a simple way of characterizing the weekly chart pattern of promising rocket stocks.   I derived this term from one of my students from last year (Marcus) who labeled three moving averages with these colors and wanted the red average to be above the white average, followed by the blue average.   I am applying these colors to   weekly GMMA charts a little differently, where the red lines are the shorter term averages and the blue lines are the longer term averages.   The key to a rocket stock is the presence of a white space between the rising short and long term averages.   It is this white space that shows me that the stock is likely to be a rocket. This pattern is universally applicable to rocket stocks. Below are two examples. (Click on charts to enlarge.)   In the future I will be discussing Red White and Blue (RWB) stocks.   Note that a submarine stock   is the opposite (BWR), with the shorter term averages below the longer term averages. In fact, CMI is a great example of a submarine stock that has transformed itself into a rocket.

Another RWB stock that came up in my Darvas scan is LOGM, which has been on fire since March. While I never know how long a trend will last and must always manage the risk of a change in trend, if I am going to own a stock, I want it to be RWB on a weekly chart.

Finally, IGTE shows that a stock can remain RWB for a long time. The key is to get on board and to sit tight, much as the great Jesse Livermore advised. If one has the patience to   ride a RWB stock for a year, one can calmly let his/her account grow, without excessive day trading and the accompanying stress that frequent trading creates.

I urge my students to paste copies of these stocks to their computer monitors and to compare all potential purchases to them. Accept no less!

My Trading Philosophy and Why I Use Technical Analysis

As a tribute to the Thanksgiving Holiday, I thought I would share with my readers the trading philosophy I have developed over the years.   It is based on my 40+ years of experience in the market and the insights achieved from my voracious reading about the market during that period. My philosophy is based on my interpretation of   such great market seers as Darvas, Weinstein, O’Neil, The Turtles, and of course, the greatest trader, Jesse Livermore. (The books written by or about these persons appear in the lower section of my blog).   Anyway, I hope you find these propositions useful and would value your additions and comments. A version of these remarks was published under the pseudonym Sir Silent Knight, as part of the Worden TC2007 daily journal.

Dr. Wish’s (Sir Silent Knight’s) Trading Philosophy

Proposition 1. The stock market and stocks are unpredictable

No one can consistently predict changes in the market or stocks. Human behavior is largely unpredictable and no one can predict world and economic events or the reactions to them. Similarly, corporate events and news can be inaccurate or intentionally misleading.

Proposition 2. However, stocks and markets often continue in trends that can last weeks or months or longer.

Trends form identifiable patterns, probably because humans react to trend patterns in repeatable ways. For example, people often trade off of support or resistance levels or at new highs or lows. While trends can be discerned once started, their length and continuation are also unpredictable.

Proposition 3. Given Propositions 1 and 2, one’s success in the market depends on identifying trends once they have begun and staying with them until they end.

But if the length and size of trends are unpredictable, each trade may or may not work out; the likelihood that any given trade will be profitable is unknown. Some successful traders have asserted that only about 50% of their trades are profitable.

Proposition 4. If only 50% of trades will be profitable, then to prosper, the profits from winning trades must be considerably larger than the losses from losing trades.

One can accomplish this goal by limiting the losses on losing trades and by maximizing the profits on winning trades. One can limit losses by setting stop losses and by making small initial trades. One can increase profits by riding the trend as long as possible AND by systematically increasing one’s position as the trend continues.

Proposition 5. Given Propositions 1-4, trading success is mostly determined by one’s strategy for exiting the trade rather than the strategy for entry.

Since one does not know at entry whether a trade will be profitable, one could probably select stocks at random as long as losses are kept at a minimum and profits are maximized. However, systematic entry and exit rules based on technical analysis can improve the likelihood of a profitable trade. For example, most stocks follow the general market’s trend, and trading consistent with that trend can enhance one’s likelihood of success. Nevertheless, given the considerable uncertainty accompanying all trades, the highest priority must be given to the rules for exiting the trade. If one enters each trade assuming that it will fail, one will be better prepared to handle losses.

It is the trader’s job to use technical analysis to develop trading rules that function consistent with these propositions. My blog, wishingwealthblog.com, documents my pursuit of this goal.

Happy Thanksgiving!