Blog Post: Day 25 of $QQQ short term down-trend; See my new way to scan for stocks near their recent ATH and GLB: $DGII

GMI1/6
GMI-21/9
T210819%

If you check out my TraderLion 2022 presentation you will find that I made the case that most of the stocks that Bill O’Neil graphed as among his greatest winners were stocks that had bases at or approaching their all-time-highs (ATH). If you want to ride a stock to the moon one needs to get on a launched rocket that is hitting a series of ATHs. I recently developed a column scan on TC2000 that helps me to find such stocks. I sought to locate stocks that are within 5% of their recent ATH. In that way I find stocks that have already had a GLB (green line break-out) or those that are somewhat below their recent ATH. I can then look at their individual charts, draw in the green lines and look for opportunities.

I create a column I call <5% below a recent ATH.  My  first filter is a condition built into TC2000 called Price New High. I select that condition and set it to monthly, 500 bar high within the last 3 bars or months. (I am content to look over the past 41 years.) My second filter is set to daily with the formula: h>.95*maxh60 (today’s high price is greater than 95% of the maximum high in the last 60 days). ( I am looking for a stock that hit a 500 month high in the last 3 months and for today’s high to be within 5% of that peak high price.) To get rid of junk, I add the conditions C>30 and V>10000. That means I only find stocks with these conditions that are today >$30 and traded >10000 shares today. Of course there is nothing sacred about these values and one may change them as s/he sees fit.

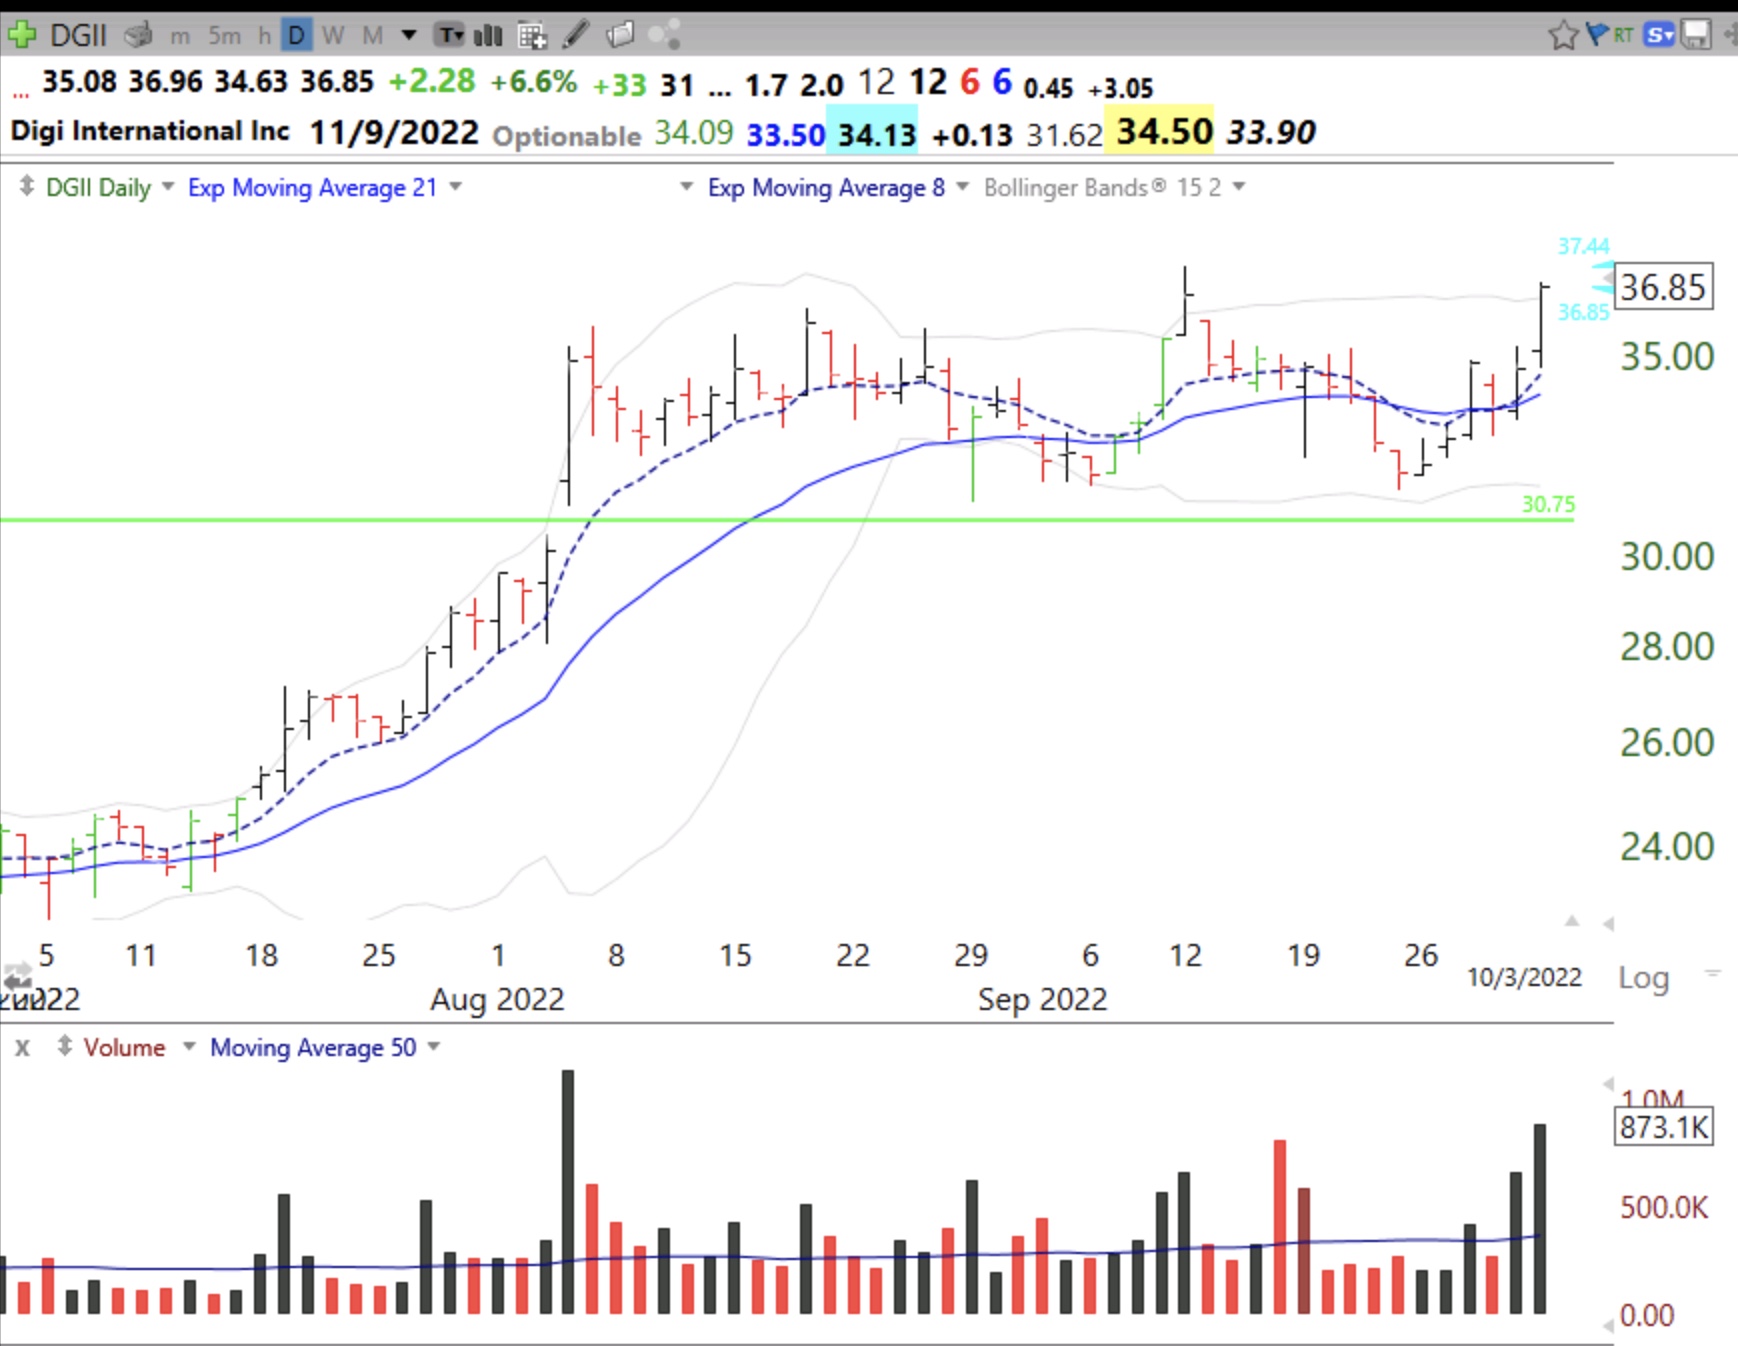
When I sort this column on my MS/IBD watchlist of  894 stocks I get 24 surviving stocks. I next looked at each on a monthly chart and drew in a green line at a monthly bar at an ATH that has not been surpassed for at least 3 months. With the green lines drawn I next look at weekly and daily charts for possible bases and break-outs. I also look at those stocks that went up today on above average volume. That is how I found DGII. DGII had a GLB in August and formed a base. Today it broke out of that base on above average volume. It still needs to surpass the high reached 15 days ago. DGII has great fundamentals on MarketSmith: EPS=98, Comp=99, RS=99. It will be interesting to see if DGII can continue higher or if the market keeps it down.  It is already up 70% from a year ago. DGII is worth watching to see if it qualifies as one of those beach balls being held under water by the market which will explode upwards when the pressure comes off.


Blog Post: Day 9 of $QQQ short term down-trend; 64 US new highs and 62 new lows; see list of 18 stocks at ATHs; analysis of $ENPH; critical week coming for $QQQ

GMI1/6
GMI-24/9
T210846%

Here are the 18 stocks on my IBD/MS watchlist that reached ATHs on Friday. They are sorted by Friday’s close/close 250 days ago. None of them have doubled. CEG has, but it is a recent IPO and did not trade 250 days ago. Any TMLs (true market leaders) among them?

ENPH is an example of a promising stock that encountered volatility last week. After having a high volume post earnings release  GLB in late July (1), ENPH went sideways along its green line for weeks. Then last Wednesday it had an above average rise to a new ATH. It closed that day above its upper 15.2 daily Bollinger band (2). This is usually an extended position, except on a break-out. On Thursday it closed again above its upper BB. On Friday, however, it had an above average volume decline and actually traded intraday below its 8 day exponential moving average (purple dotted line). But it closed the day above that average (3). A close below that average would be one initial sign of technical weakness. If I owned it I would consider the GLB to have failed if ENPH closed back below its green line (282.46). If I purchased it based on the GLB set-up, I would then have to sell out until it closes back above the green line.

On the other hand, I always want to check a weekly chart before selling. This weekly chart of ENPH looks quite strong, with the 4wk avg>10wk avg>30 wk avg. And it closed up last week on higher volume. For a longer swing trade I would not sell until ENPH closes the week below its 10 week average (purple dotted line, at 266.43). The fact that last week was also a weekly green bar is a plus. A weekly green bar is drawn  when the 4wk>10wk>30wk avg and the current bar bounces up off of the rising 4wk average and closes the week above it.

Meanwhile the GMI remains RED but gained a point Friday as the IBD growth mutual fund index retook its 50 day average. I also noted below that SPY has closed back above its 10 week average, a sign of strength. But the market remains in a Stage 4 down-trend.

Last week QQQ rallied back to just below its 4 week average (red dotted line). A close this week below the 4wk avg would be a sign of major weakness to me. Be careful!

Blog Post: Day 28 of $QQQ short term up-trend; $QQQ very oversold and bounce likely; GLB: $CLH, how I buy a GLB automatically

GMI5/6
GMI-22/9
T210864%

QQQ reached very oversold levels yesterday last seen in June before the recent rally began. 53% of NASDAQ100 stocks had  a daily 10.4 stochastic <20. Last June 16 at the bottom,  85% traded that oversold. Since June 24 only one day had more than 10% of NASDAQ100 stocks with such the stochastic<20. The GMI remains Green and the QQQ short term up-trend remains intact for now. However, a few more declines in QQQ could end the short term up-trend. With the futures up this morning, we may get an oversold bounce.

I had noticed a few days ago that CLH, a stock brought to my attention years ago by my stock buddy, Judy, was approaching a GLB at $118.89. How could I buy it if it traded through that price without being glued to my monitor? Nicolas Darvas had the answer. He was busy dancing around the world as he made 2 million dollars ($20 million in today’s dollars) in 18 months in the late 1950s. His classic book is listed at the end of this blog. Because Darvas could not spend his time following his stocks with his broker, he had no personal computers, he used buy stop orders. Once he had figured out a possible break-out price he had his broker enter a good til cancelled buy stop order. This meant that as soon as the stock traded at the price he specified his order to buy shares was entered as a market order. Darvas said that the buy stop order was a critical tool for him.

A buy stop order is  potentially dangerous because it normally tiggers a market order to buy. If the stock opens up way above the stop price one would have to buy it at the higher price.  I trade in my IRA and my broker does not allow buy stop orders in that type of account. Instead I can order a safer buy stop limit order. A few days ago I entered an order to buy CLH on stop at 118.95, limit 120. That way I will not buy it above 120. It was executed automatically at 119 and closed the day at $122.27. I now have to decide where I will exit if the GLB fails. (I could also have entered a stop loss order to be executed automatically once the buy stop limit order had been executed.) Be careful, because once one buys the stock it could reverse down quickly and  be stuck with a loss. So it is good to monitor one’s executed trades sometime during the day. Darvas probably would have done so if he had a hand held computer back then. Here are daily and monthly charts for CLH.