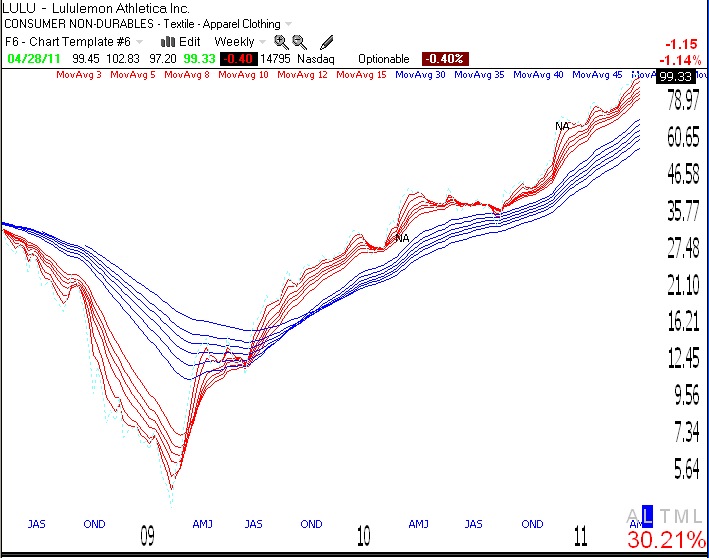
Closing out a great year for the QQQQ, near its 2007 peak; Happy New Year!

GMI6/6
GMI-R10/10
T210865%

Do not look for predictions of the market over the next year.   No one knows what the market will do.   All we can do is discern the current trend and ride it until it ends.   We end the year in the middle of a QQQQ short term up-trend, which reached day 28 on Thursday.   The prior short term up-trend lasted 51 straight days and was followed by a 2 days short term down-trend.   With the exception of this brief down-trend, the market has been rising for 79 days! It doesn’t get much better than this.   The monthly chart of the QQQQ (Nasdaq 100 index ETF) shows the large rise in   tech stocks since the early 2009 bottom, followed by a few months of consolidation in 2010 and the continuation of the up-trend for the past 4 months. The QQQQ has risen +18.4% since December 30, 2009.   At Thursday’s close of   54.66, the QQQQ is   slightly below the 2007 pre-decline top of 55.07.   Will it hit resistance here? The Worden T2108 indicator is only at 65%, in neutral territory.   So, I will remain fully invested in mutual funds in my university pension, and holding stocks and options in my trading accounts.   Next year will undoubtedly bring some down-trends, and I will   reduce or eliminate my long positions when they become evident.   Until now, let’s all enjoy this incredibly strong market up-trend.   Happy New Year to all of my valued readers.   I hope you have benefited from my posts. Let me know.

26th day of QQQQ short term up-trend; dollar trend up

GMI6/6
GMI-R10/10
T210863%

While the short and long term up-trends are intact, the leaders look very tired.   Six of the nine leaders I follow declined on Tuesday, as did 64% of the Nasdaq 100 stocks. CMG and BIDU look very weak.   NFLX has bounced up off of support and it will be important to see if it can hold. AAPL has been slowly inching up, but GOOG has been weak…..

MCP, a hot rare ore play,   had a high volume reversal on Tuesday and GLD seems to have resumed its up-trend.   However, the dollar is now headed up, as shown by this daily GMMA chart, where all short term averages (red) are now above the longer term averages (blue). Click on chart to enlarge.