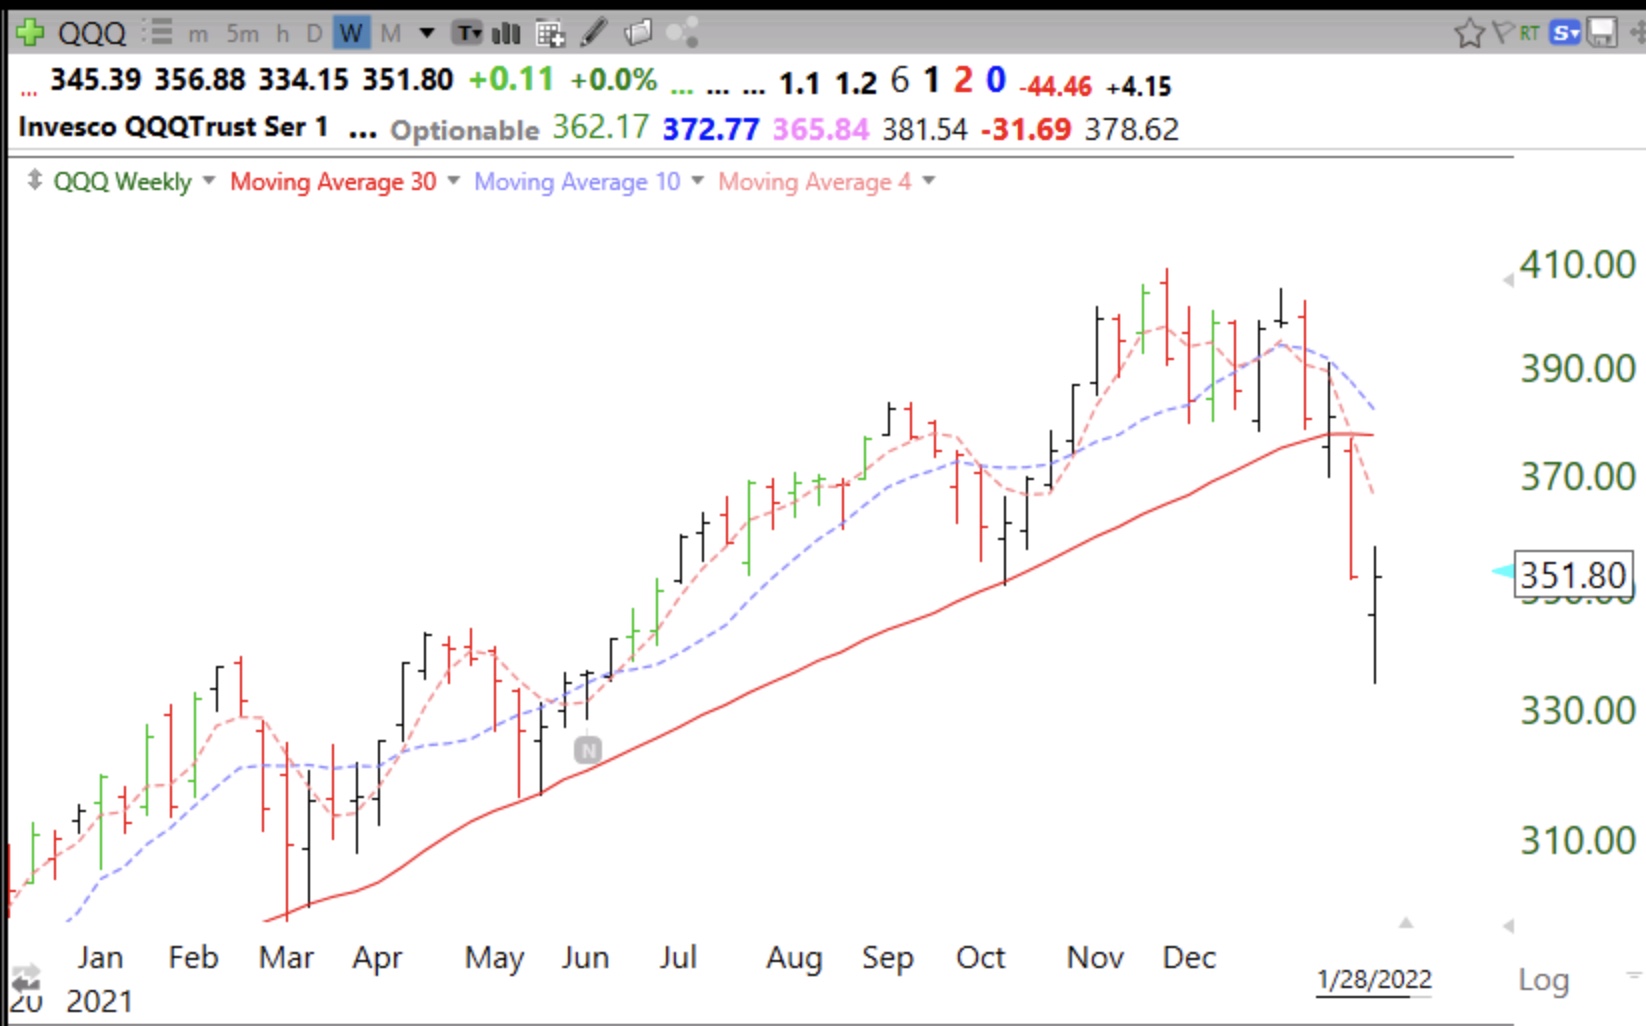
Once a significant decline has begun, no one knows when it will end. Now that the QQQ is below its 30 week average (solid red line), the first thing I will look for is a close above that average. But as I showed in last week’s AAII Eastern Michigan Chapter webinar (will post link to recording here when I receive it), the index can whip-saw above and below that average. I therefore want to see the 30 week average curving up again. That is the definitive signal to get me back in. Other important early indicators of a possible bottom are the p/c ratio >1.10 and T2108 <10%. T2108 reached 12% last week and is now at 21%. The p/c ratio=.93 and reached 1.08 last week. If T2108 goes below 10% I will buy a little SPY and buy more only at higher levels after a bottom is in. Here is the weekly chart of QQQ.
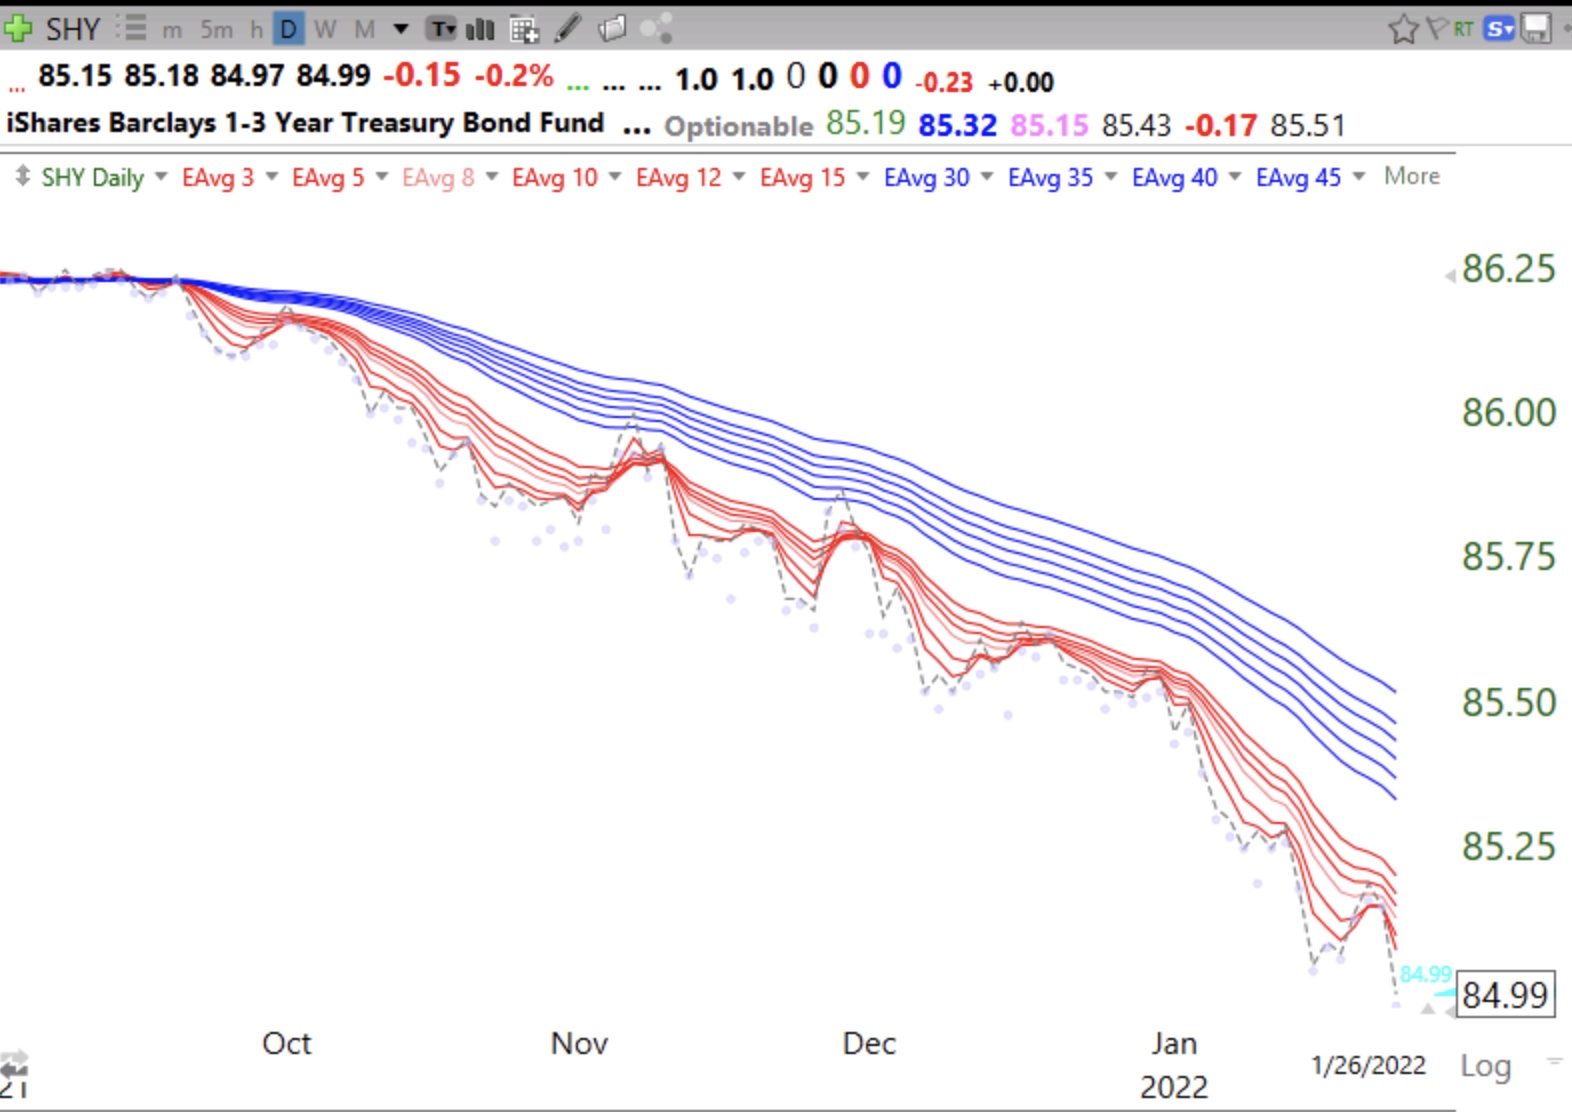
Another chart I will monitor is my daily adapted GMMA. When it returns to a daily RWB up-trend it could indicate a short term bounce.
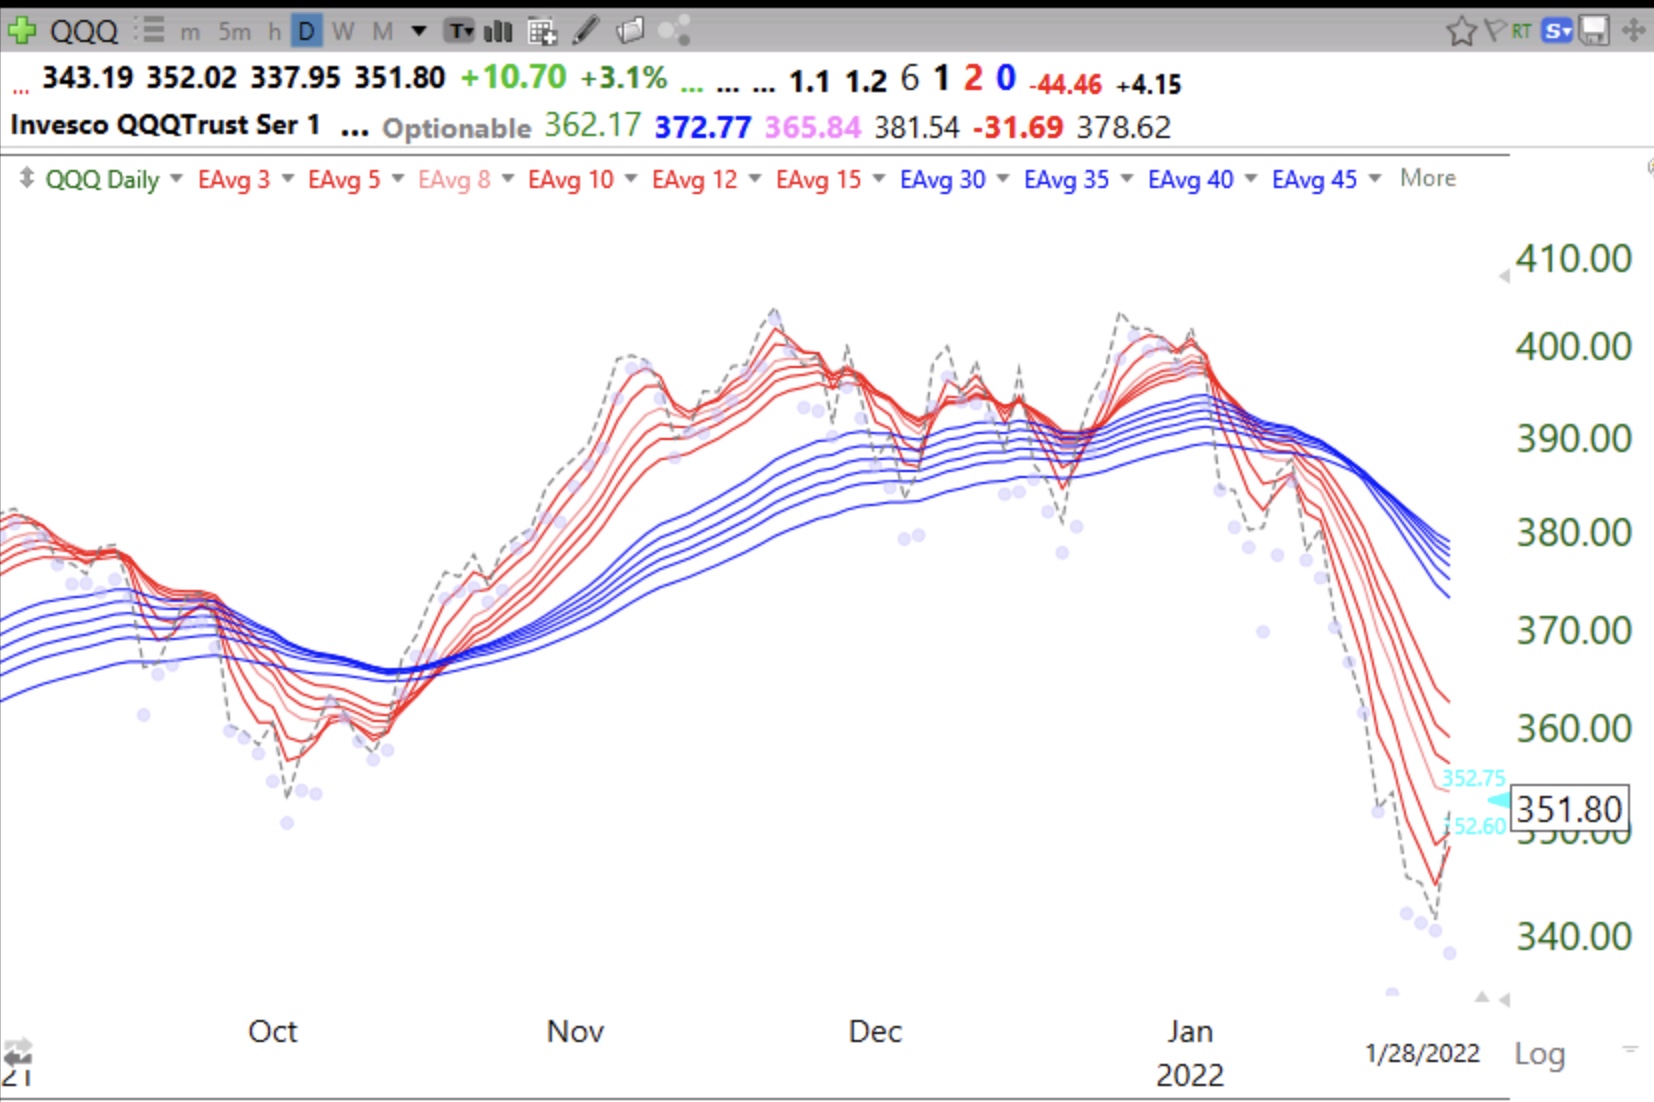
By definition, a trend follower follows the trend. I will get back in long after a bottom is formed, not before. Going in early in anticipation of a change in trend often leads to losses. If the 30 week average curves down it will signify to me the beginning of a major decline. At least that is what has signaled the start of prior bear markets, also shown in my webinar.
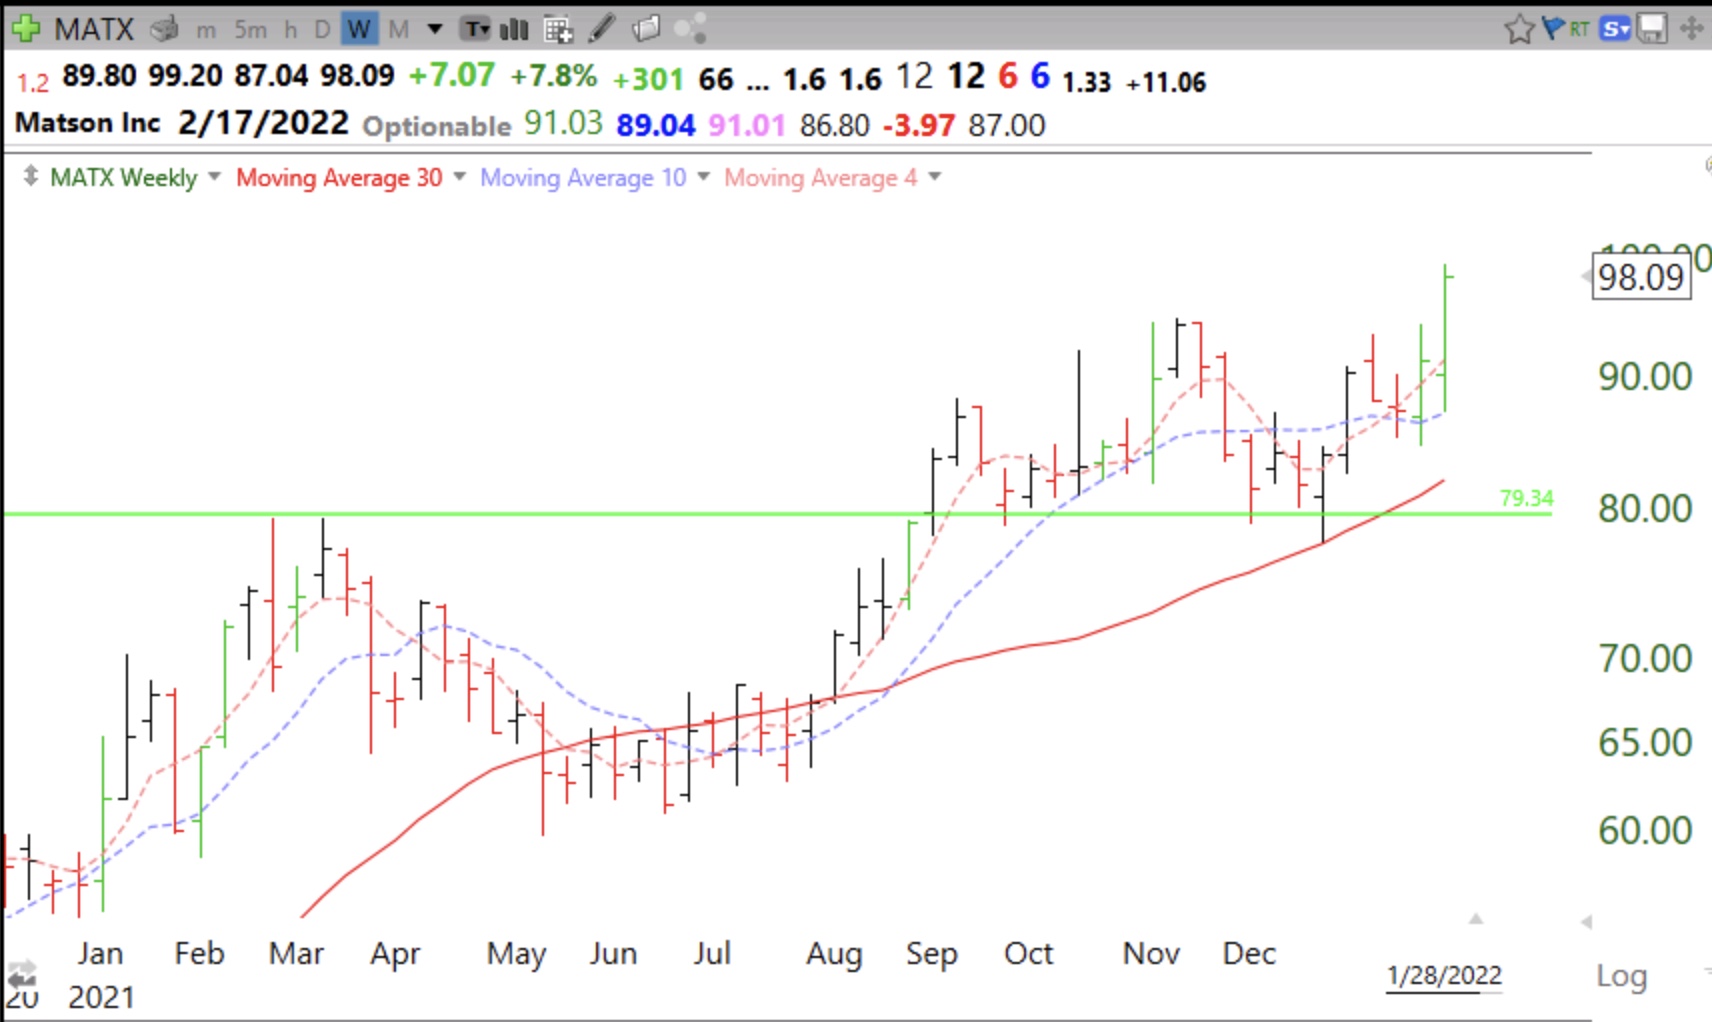
Just for fun I ran my TC2000 scan for promising stocks near their all-time-high and having strong technicals. Only 4 stocks appeared out of 777 in my watchlist of stocks that have appeared in promising IBD and MarketSmith lists. These are: MATX, ZIM, MCK and COP. All 4 traded at all time highs (ATHs) last week. Only in a market up-trend would I buy any of these. Here is the weekly chart for ZIm. Note that it retook its green line last week and reached an all-time high. After a major market decline any stock trading at its ATH is a potential leader.
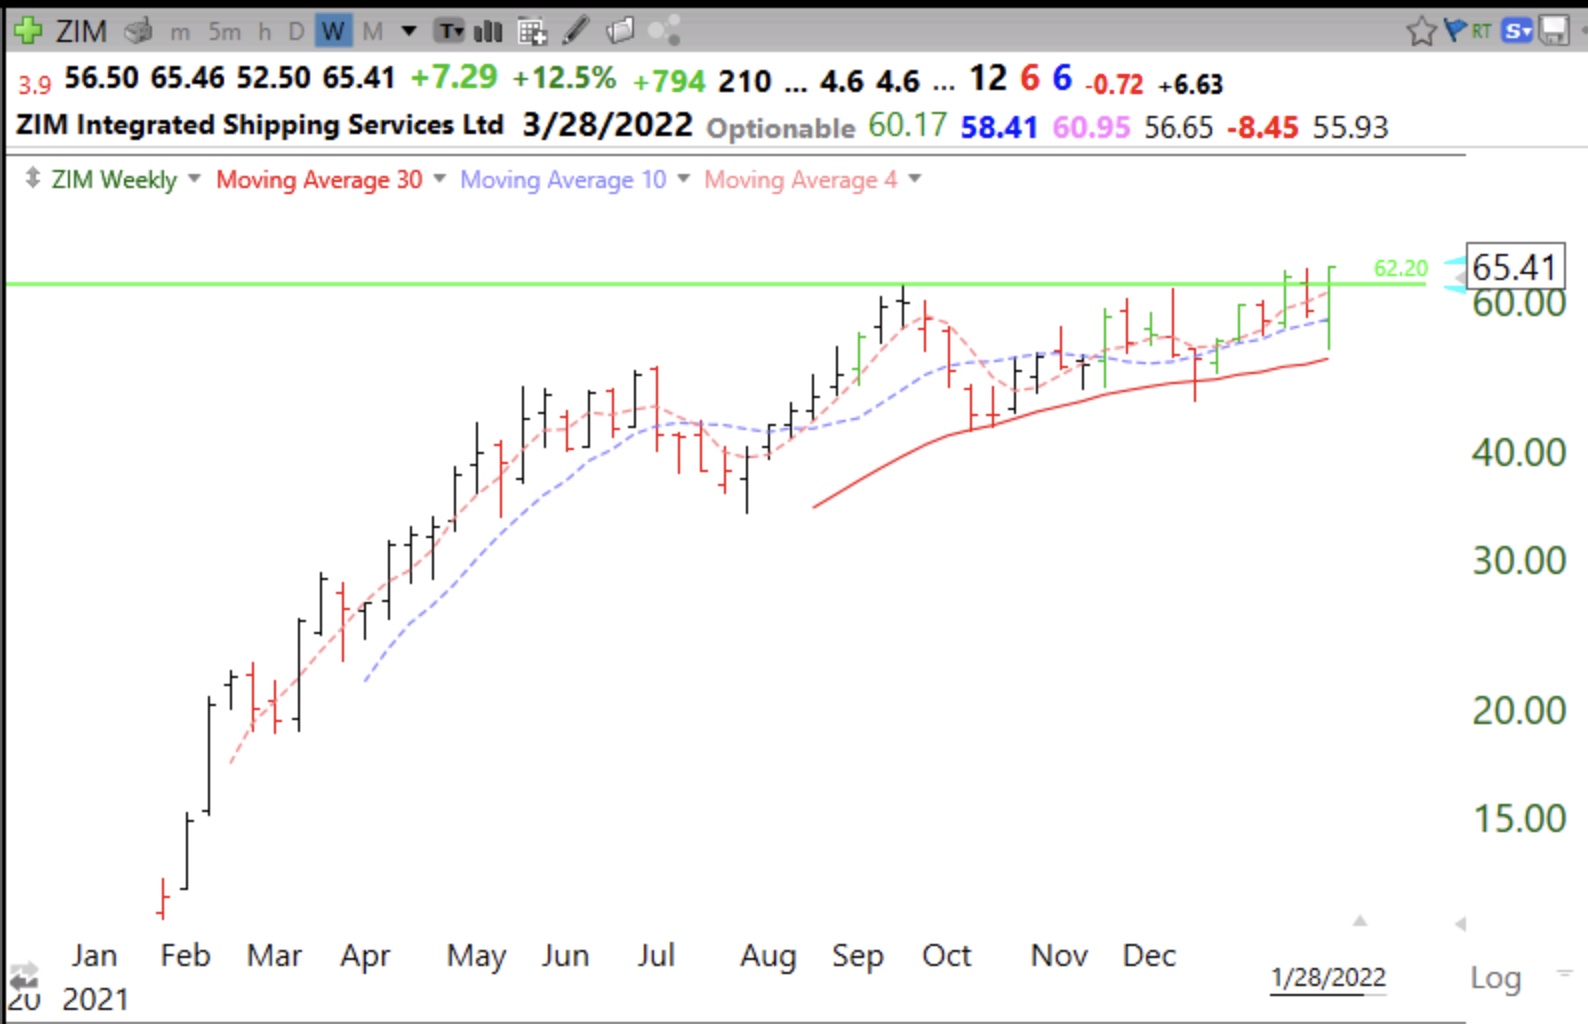
Interesting that 2 of 4, both ZIM and MATX, are in the shipping business. MATX is also above its last green line top.
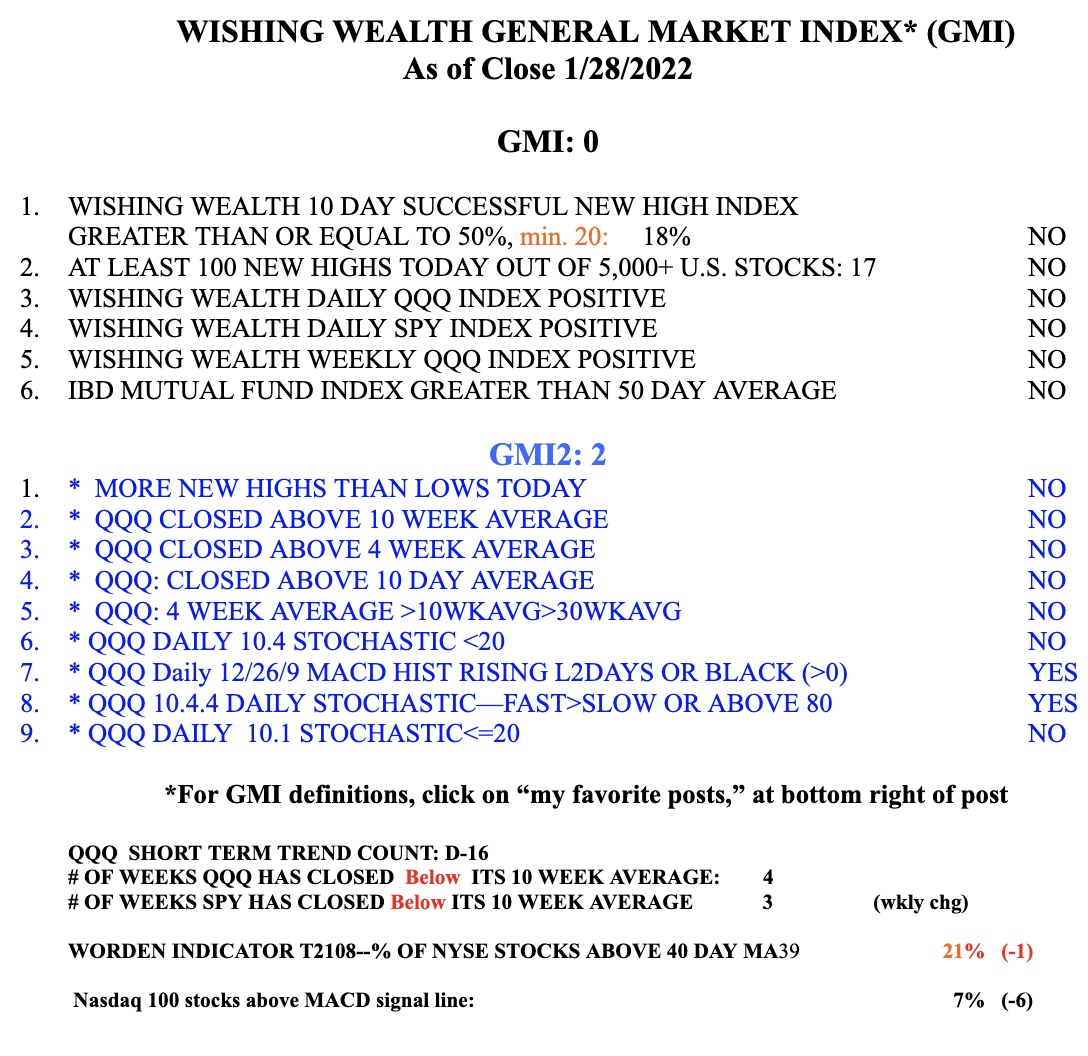
The GMI= 0/6 and Red. It is so much easier to profit going long when the GMI is on a Green signal. I stay out and conserve my capital for the next sustained up-trend. Watch out for brief bear market rallies.They can be treacherous.