Blog post: $SPY, $DIA and $QQQ close below 30 week averages; These charts show how easy it was to avoid the declines in $NFLX and $ARKK—technicals work! Come to my free AAII webinar.

GMI0/6
GMI-21/9
T210827%

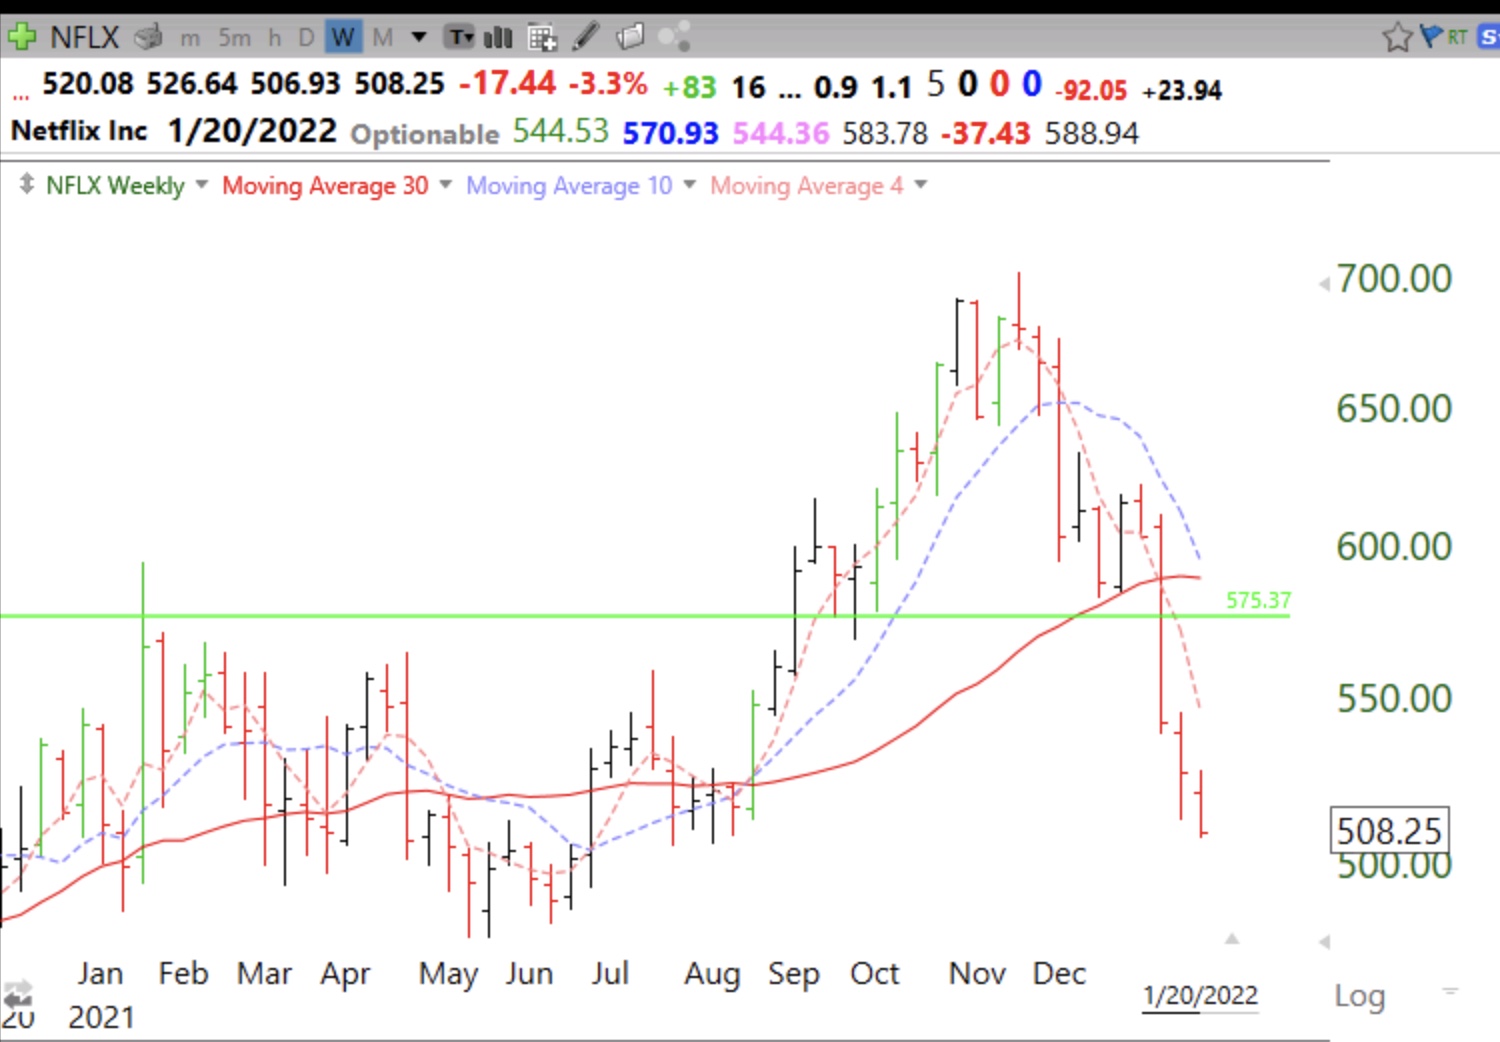
This weekly chart shows that NFLX, which dived tonight after earnings, should have been sold 2 weeks ago when it closed below its 30 week average (red solid line) and below its green line (a failed green line break-out, GLB). These signals help me to avoid major declines. I hold no stock or ETF below its 30 week average or a failed GLB.  And now the major indexes are below their 30 week averages……

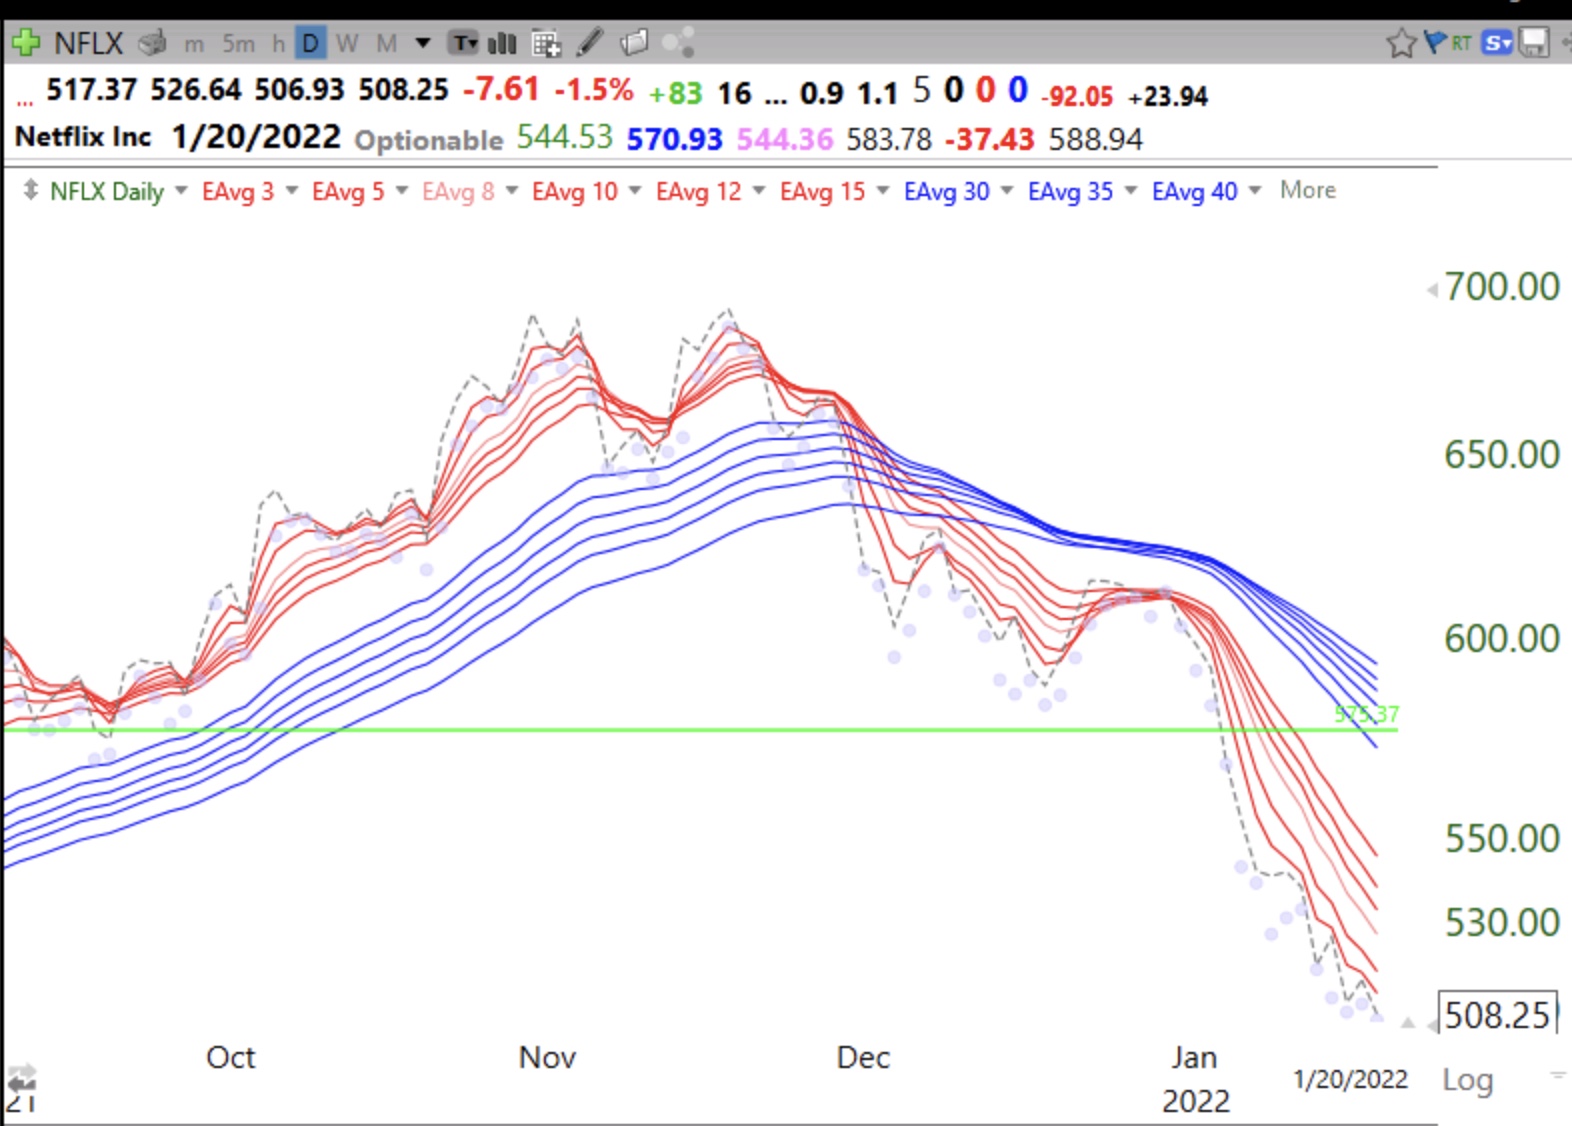
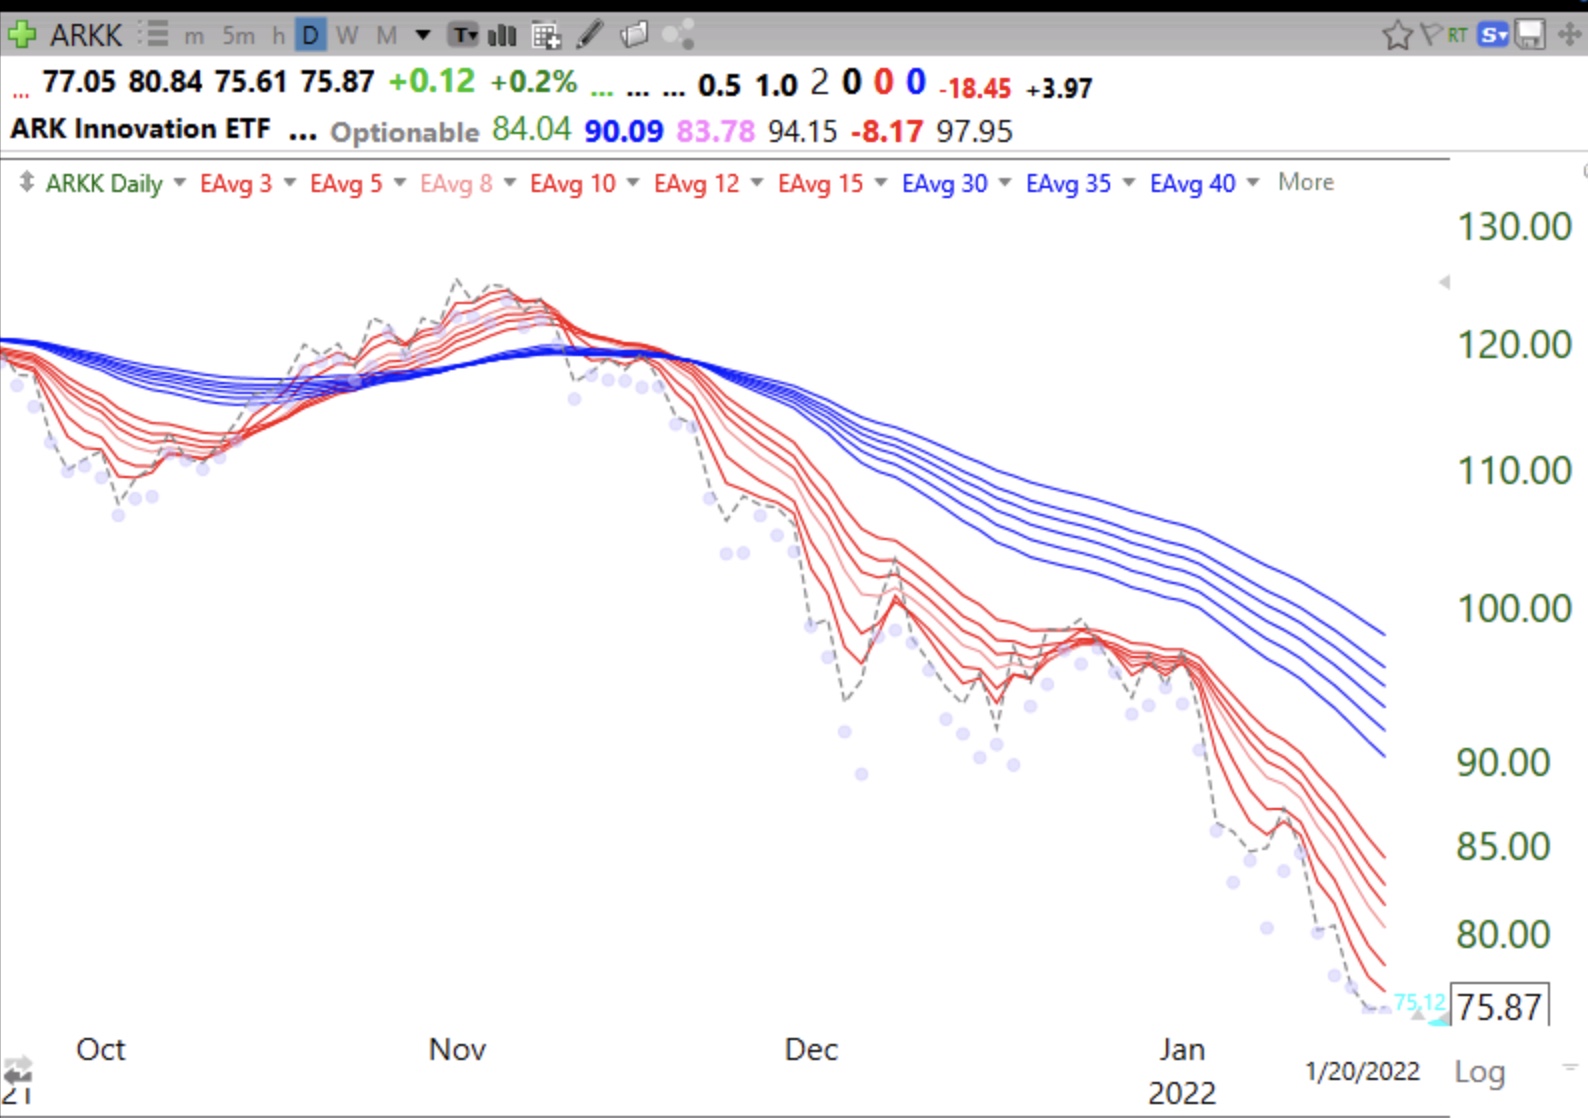
The daily GMMA signaled a break in trend in December when the RWB up-trend ended. (red averages converged with blue).

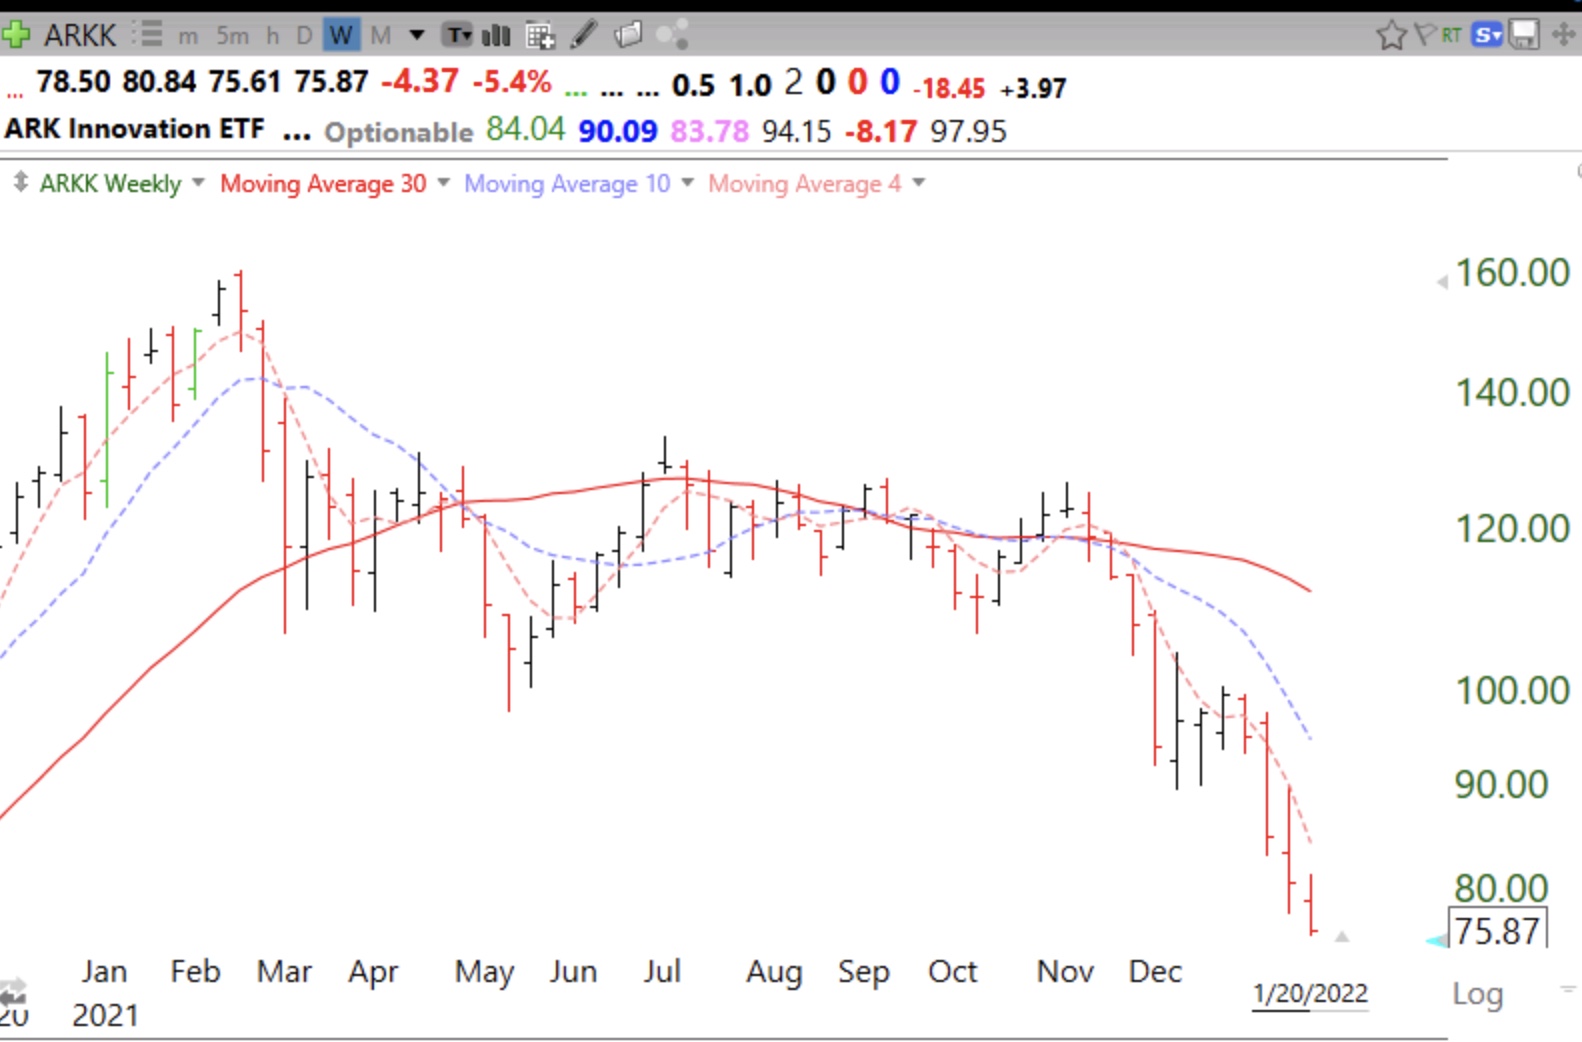
$ARKK has been in a Stage IV decline since Thanksgiving. And in a Stage III top May-October.

Daily GMMA chart has been in a BWR down-trend  since  Thanksgiving.

I will describe these indicators during my Eastern Michigan AAII presentation this Tuesday. Register for this free webinar here.


Blog post: Register for my free AAII presentation on 1/25; Day 8 of $QQQ short term down-trend; GMI=1, IBD calls market correction; $QQQ below 30 week average, see chart; in cash

GMI1/6
GMI-21/9
T210837%

Next Tuesday at 7 PM I will present to the Eastern Michigan AAII group.  Register here free.

As bad as things look, the real decline may be yet to come. Below is the weekly chart of QQQ. When/if the 30 week average (red solid line) turns down it would signal to me the beginning of a significant Stage IV decline. That signal is what got me out of the market in 2000, 2008 and 2020 near the beginning of the drop. But often times the indexes bounce around this average before everything sinks. It takes a while for the buy the bargains on the dip crowd to give up. I am already mainly in cash in all of my accounts. I began lightening up in November, as I wrote then.