Blog post: Day 1 of $QQQ short term down-trend; holding $SQQQ and cash; see BWR patterns in hourly charts for $QQQ, $AAPL, $SPY and GMMA video

GMI3/6
GMI-21/9
T210847%

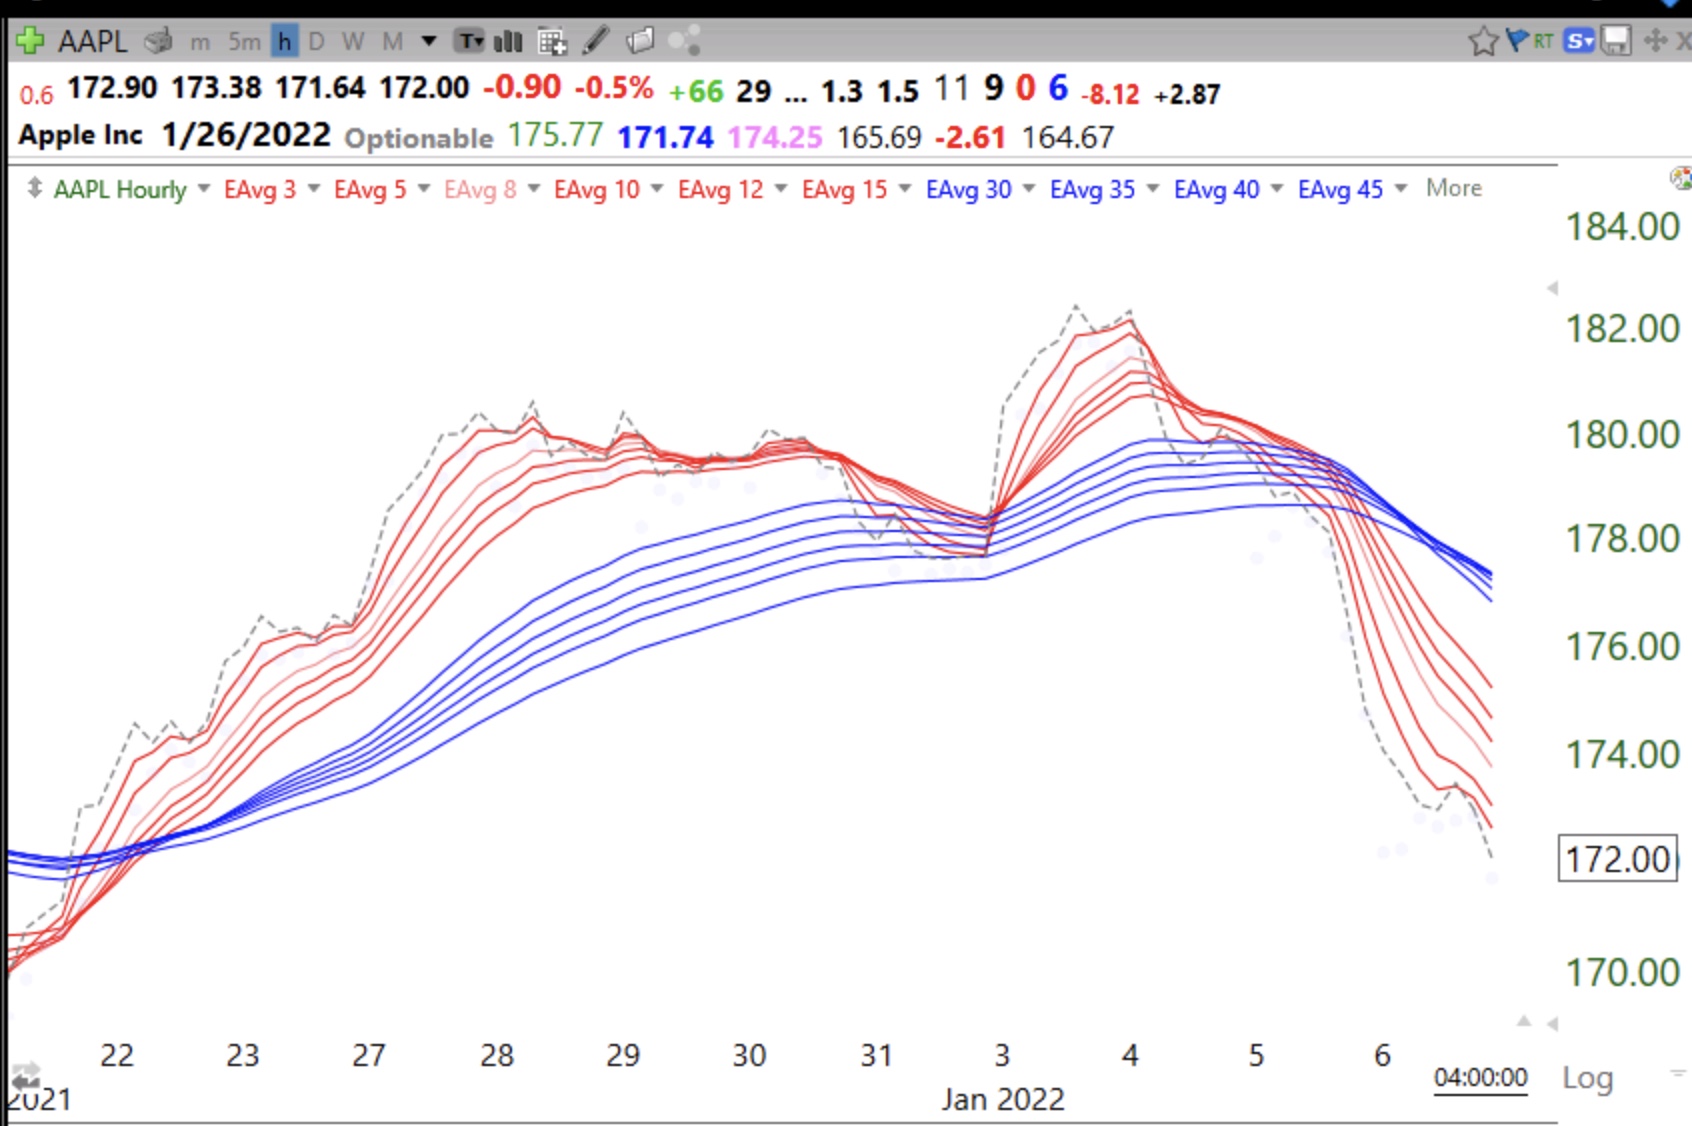
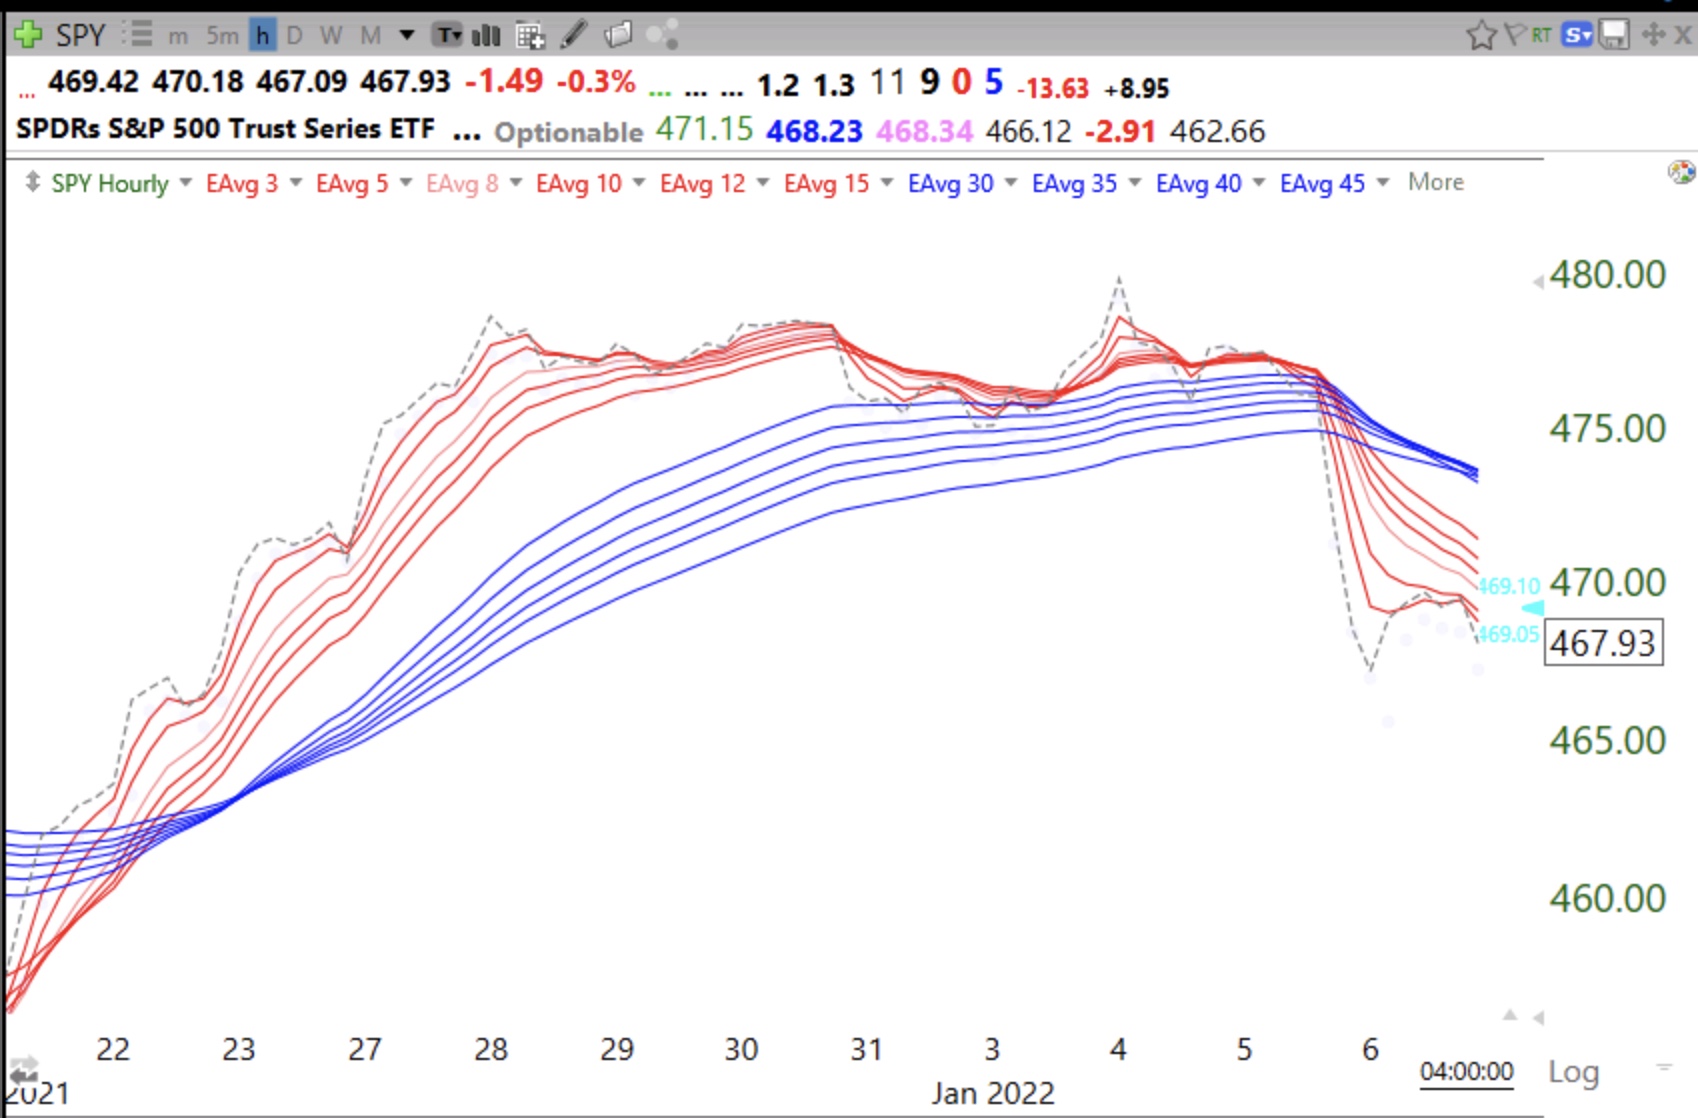
I usually look at the adapted GMMA daily and weekly charts to see the trend of the market or individual equities. However, for timing entries and exits, the hourly GMMA may prove useful.  Check out the clear hourly blue-white-red (BWR) down-trends in  QQQ
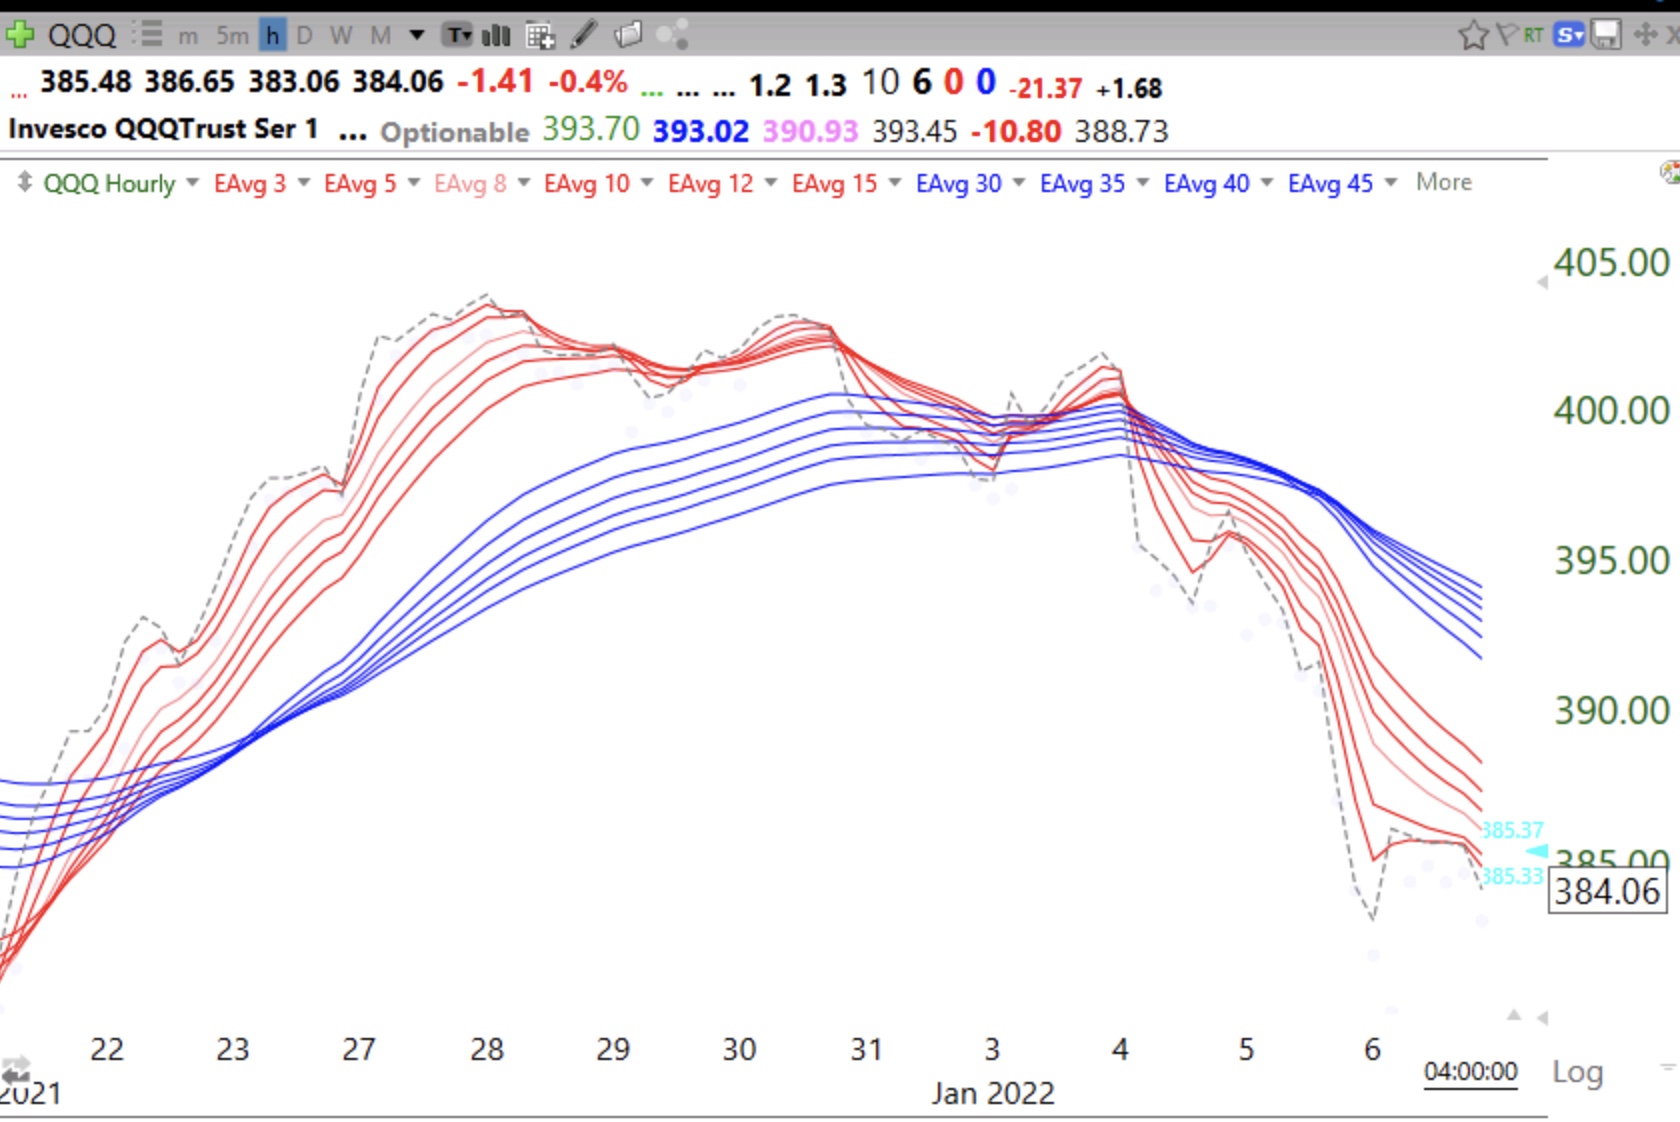
and AAPL and SPY.

My former student, Richard Moglen, has a tutorial for creating GMMA charts in TC2000.

Blog post: $QQQ short term up-trend likely to end Thursday; see $SHY in Stage IV decline and $TLT, indicating rising interest rates

GMI5/6
GMI-21/9
T210845%

I had felt  that when the Fed announced it was tapering and raising rates, it did not make sense for me to be long stocks. Most break-outs have failed. So I have been mainly in cash in my trading accounts. I own some SQQQ. I have also been reducing exposure in my university retirement accounts. I suspect that rising interest rates will eventually kill the bull. It always has in my experience. Never fight the Fed. Look at the short term treasury bonds, SHY. See a trend? Stage IV down-trend.  Remember, lower treasury bond prices=higher interest rates.

Longer bonds are also starting to decline.