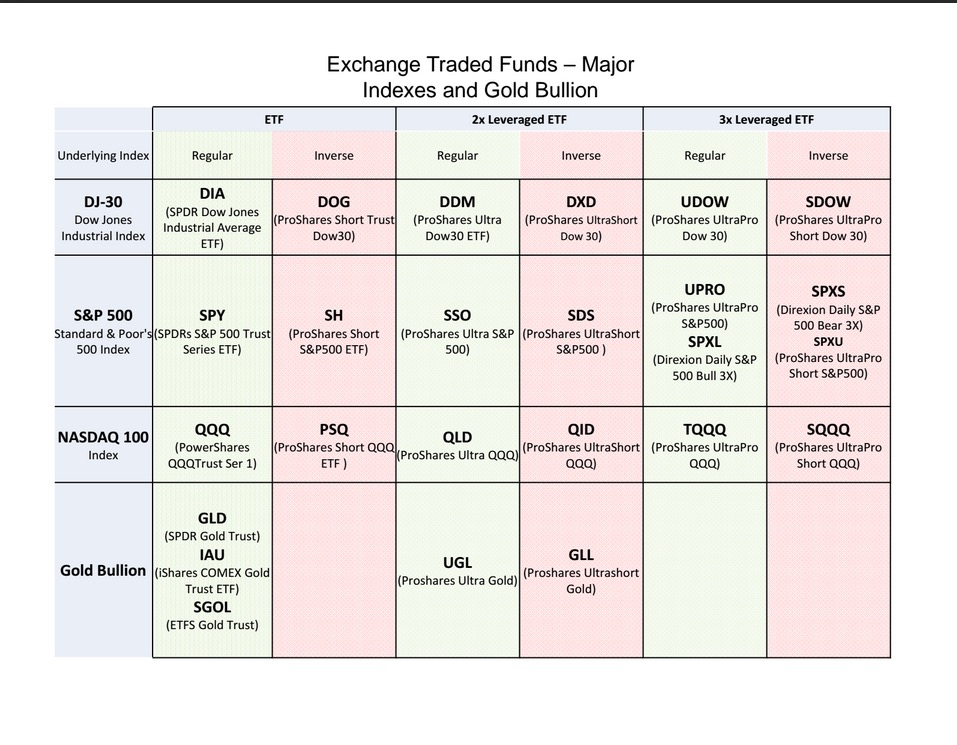
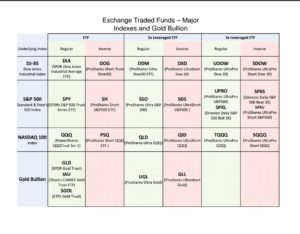
A number of you have asked me about inverse index ETFs so you could short the market. Below is a table that my co-instructor, David, built for the undergraduates enrolled in our stock market class. The table includes leveraged ETFs, which attempt to move 2-3 times the underlying index. Leveraged ETFs can be dangerous. It is important to read up on how they work and to monitor holdings quite carefully. The table also contains some ETFs that trade long or short with the price of gold. There is also a whole new class of light leveraged ETFs, not in the table, which you can learn about here.
 I will be presenting a 3 hour workshop for the AAII DC Metro Chapter in Virginia in February. It is open to the public. While there is a small charge, the money raised goes to cover the expenses for the venue and to support AAII and my substance abuse research center at the university, both good causes. My co-instructor, David, and I take no compensation for the presentation. A notice about the workshop appears here. For those of you who want to learn more about my approach and to ask questions, here is our chance to meet. Just click here to learn more or go to: http://www.aaiidcmetro.com/
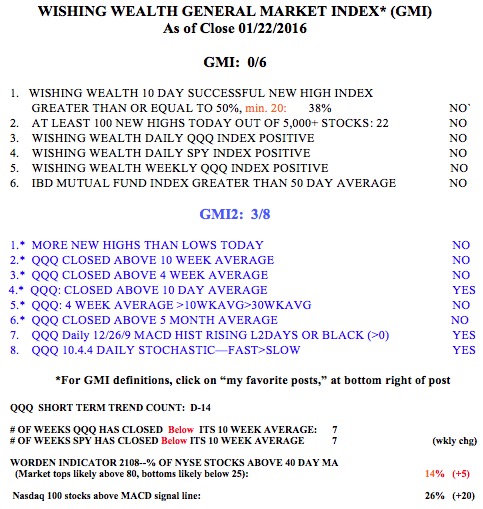
The GMI remains at 0 (of 6) but the very sensitive GMI-2 has climbed to 3 (of 6). If the market indexes remain in a down-trend and they become short term over bought and begin to weaken, I might buy a leveraged inverse index ETF. It is important to always trade with the market’s trend. The T2108 is now at 14, and no, I did not have the courage (foolishness?) to buy a bullish index ETF when T2108 was below 10!
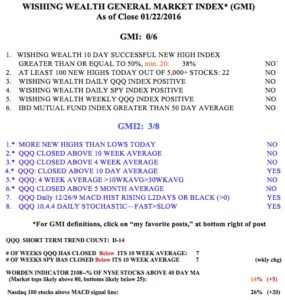
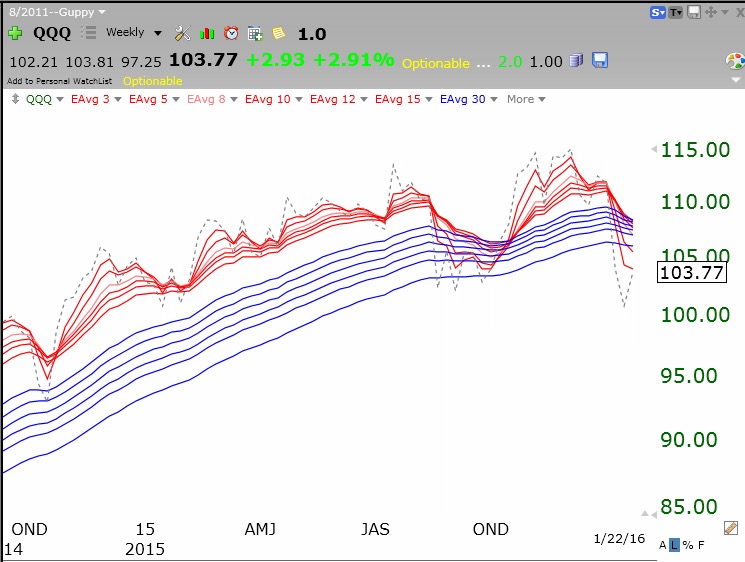
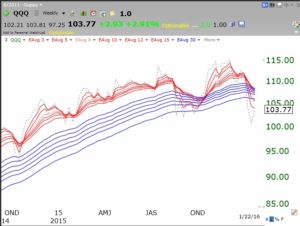
If the QQQ (103.77) could close back above all of these 12 weekly exponential moving averages, around 108.40, I might suspect a new up-trend. For now, I am looking for the proverbial “dead cat bounce.”
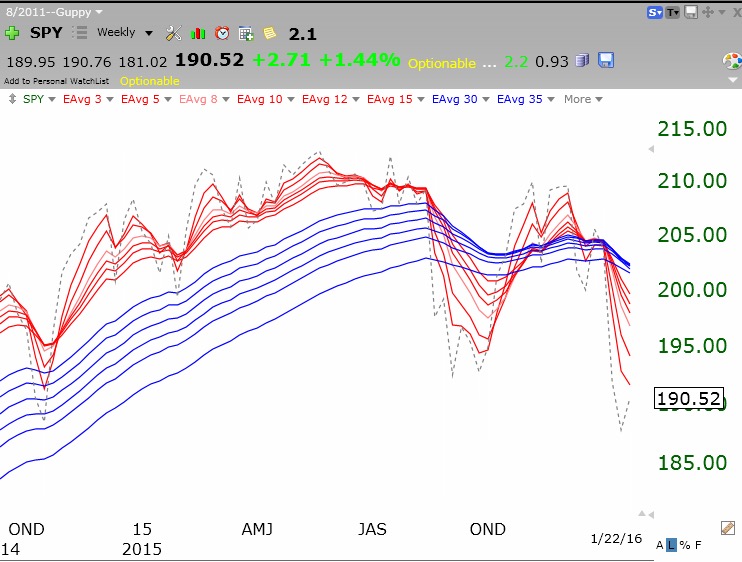
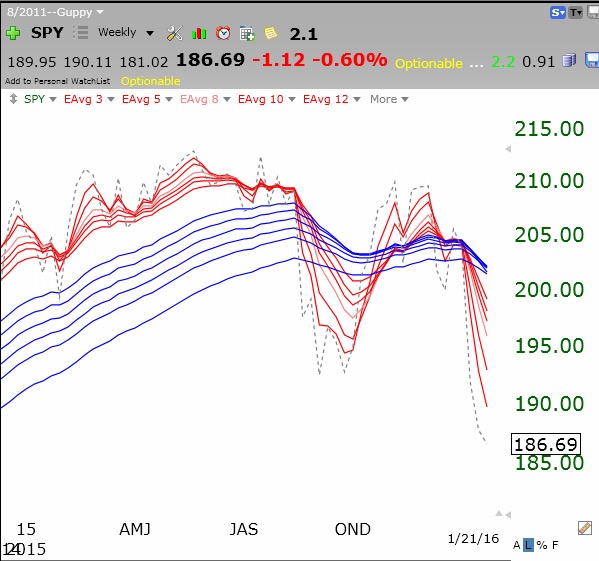
 The SPY looks even weaker than QQQ and remains in a BWR down-trend:

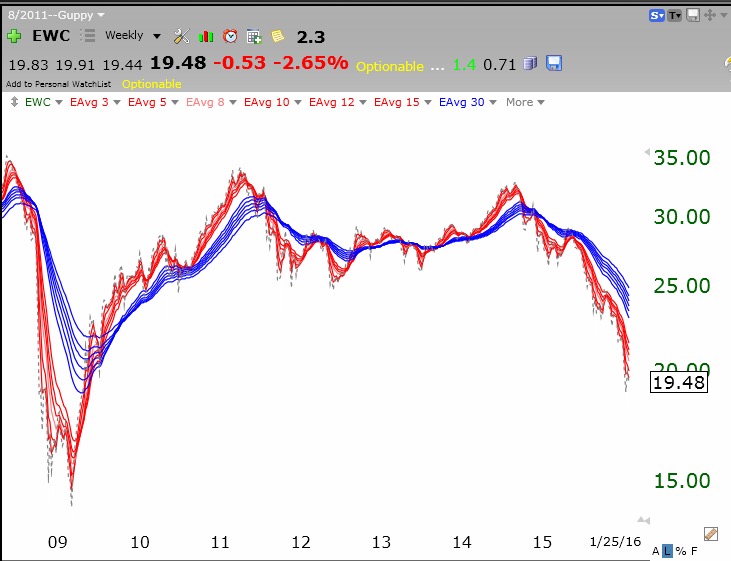
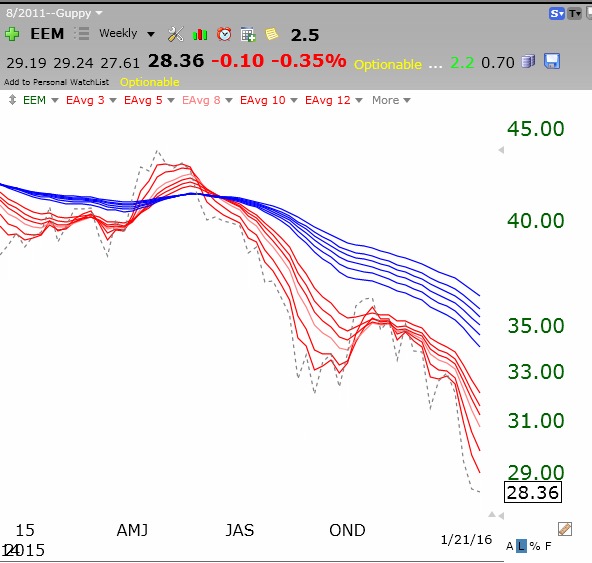
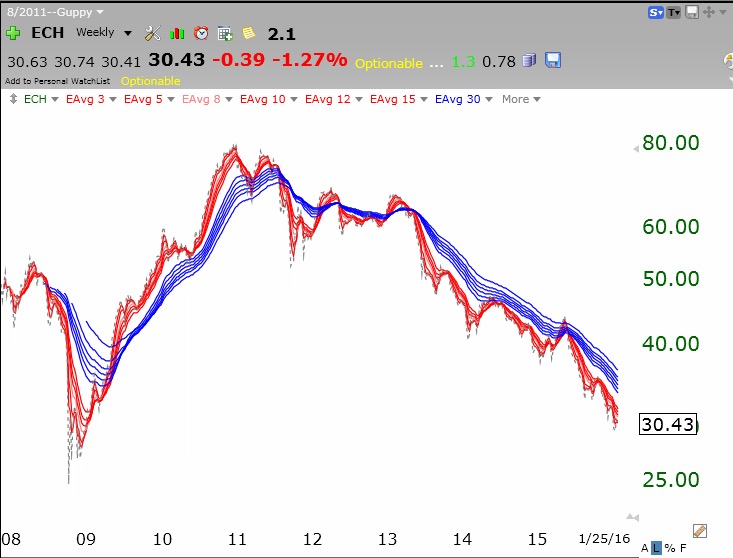 All world indexes I checked are experiencing BWR declines! Can we blame everything on China?