GMI: 5; GMI-R: 9; My General Market Index (GMI) catches trend changes again!; More Judy’s picks–ITRI and IMAX

The GMI is at 5 (of 6) and the GMI-R is 9 (of 10).  The only indicator that is not positive is the Weekly QQQQ Index which indicates that the major longer term trend is still down. Gmi0418
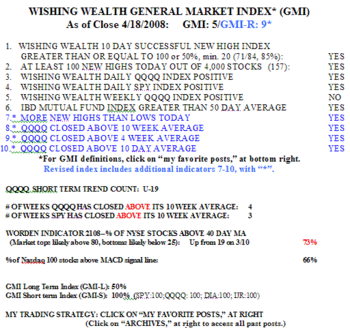
But the short term trends are all positive. The GMI-S is at 100%, indicating that all 16 short term indicators for four key index ETF’s are positive.  The GMI-L is still at 50% indicating that only half of the longer term indicators are positive. I wrote when I started this blog 2 years ago that my indicators have kept me on the right side of the general market’s trend since  1998.  I have been largely out of the market in all major declines and back in for each ensuing recovery.  For example, I closed out my margin account in October 2000 and cut back in my IRA trading account;   my IRA was up more than 50% during the 2003 recovery.  I also switched my university pension mutual funds to cash during 2000-2002.  I have recently been in cash in my university pension funds since December and will remain in cash until the GMI rises to 6.  To show you how possible it is to time the market, in 2000, I got out of my university pension growth fund around $103 and by 2002 it was trading in the 30’s. All this time the buy and hold crowd was urging the masses to stay invested, lest the market take off without them.  This advice is garbage and many people were hurt.  Once the market turns it rises for months and there is always plenty of time to get on board.  No one can know for sure whether the current rally is one of those major turns.  The key for me is to watch the market movement as reflected in the GMI, and to ignore the news and the media pundits.  When the the train is moving in the right direction, one should hop on and not argue with others regarding whether it should be moving or how far it will go.  If the train reverses I can always hop off and wait for it to come my way again.  The key is to use tax deferred accounts where there are no tax consequences from getting in and out of positions….

After watching Judy’s marvelous pick, CPST, take off, up 50% since I mentioned it, (and 200% since Judy bought it) one of you asked me whether Judy has more picks.  Of course she does!  Two stocks she told me about that I own and am watching closely are ITRI and IMAX.   Both are "concept" stocks, the only type she buys.  Her picks do not always work out and I tend to wait for the right technical signal to buy them, usually  at higher prices than she does.  IMAX has been acting weak but is holding up, and  ITRI looks good to me if it can break $101 and hold it….
GMI: 5; GMI-R: 9; QQQQ short term up-trend confirmed!; 41 IBD100 new highs

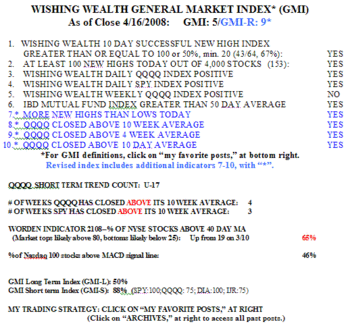
I wrote yesterday that the QQQQ was hovering on support and would either fall off of the cliff or bounce.  On Wednesday, for the first time since February 26, I have registered more than 100 new highs in my universe of 4,000 stocks.  There were 153 new highs and 50 new lows on Wednesday. Gmi0416
(Click on chart to enlarge.)  The last time the GMI was above 4 (it was 6) was on December 26, 2007.  The QQQQ successfully tested its up-trend on Wednesday with 94% of the Nasdaq 100 stocks advancing.  While very close, the QQQQ never violated its short term up-trend; Wednesday was the 17th day of the up-trend that I identified on March 25 (U-17).  Again, I had to learn the lesson not to anticipate a change in trend and  kept a lot of my longs through today, although I was hedged and made less money than if I had just stayed 100% long with the up-trend.  It is now time for me to accumulate QLD (the Ultra long QQQQ ETF) and other strong IBD 100 stocks.  41 of the  523 stocks on the IBD 100  lists I have monitored the past year hit a new high on Wednesday.  They are: BMI,AGU,VMI,POT,SID,MOS,MON,MEE,KSU,
SCHN,CF,X,GGB,CENX,KOP, BDE,TTES,XTO,NEU,OXY,BTU,
MT,NBL,WHQ,JOYG, RTP,ATW,EGN,RS,KWK,WFT,COG,SWN,BUCY,FTI,
HK,UPL,RRC,ATLS,OIL,ATN. Note how many of these stocks are from the oil, metal and agricultural chemicals industries.  These stocks continue to lead this market.  Stocks that break out to new highs quickly in an up-trend tend to be among the next rally’s leaders.  The key is to buy strength and not to bottom fish.  The fish on the bottom tend to eat garbage.

GMI: 3; GMI-R: 7; 9th day of QQQQ short term up-trend; QLD; URBN

The GMI declined one, to 3 (of 6) and the GMI-R to 7 (of 10).  I am not worried by this minor decline which was caused  by my Successful 10 Day New High indicator’s turning negative.  This indicator is very unstable when only a few stocks hit new highs 10 days ago. The QQQQ is now in its 9th day of a short term up-trend.  I am making money again!  The QQQQ is well above its 10 week average, which in turn is beginning to turn up.  When the QQQQ is above its rising 10 week average I have the best chance of profiting from buying IBD 100 type growth stocks hitting new highs. 

During the QQQQ’s recent 55 day down-trend, that index (Nasdaq 100) declined about 11% and  72% of its component stocks declined; 31% declined more than 15%.  During that same period, 65% of the S&P 500 stocks declined, along with 70% of the Dow 30 stocks.  Again, we see that when the QQQQ is in a down-trend, the odds are 2 to 1 that an individual stock will decline, not good odds for going long or holding stocks.  On the other hand, going short would have worked very well.  During this period of decline, QLD, the Ultra long QQQ ETF,  declined about 24% while QID, the Ultra short ETF rose 22%. You can see that if one can identify market trends early, all that one has to do is to trade these two ultra QQQ ETF’s to earn a nice return. So, since the beginning of the new QQQQ up-trend, QQQQ has advanced 2.3% and QLD, 4.4%.  By the way, one can buy these ETF’s and even write covered calls on them……

Some of my students are resisting the current up-trend because of all of the bad news about the economy.  I reminded them that if one is crossing the street and sees a truck bearing down on them, one does not argue about whether the truck should/will stop or shouldn’t be acting that way. One must get out of the way or hop on board if it is going in the right direction.  To wait for the economic news to turn good is to miss much of the move and to increase the odds of buying at a top.  The news is usually worst after the market has already turned.  As long as I have rules for getting out of my positions if the market returns to a down- trend, then I am content to go long now.  The great speculator, Bernard Baruch, bought and sold his positions repeatedly in 1929 until he finally caught the major trend down.  With commissions so low and having no tax consequences or wash sale rules while trading within my IRA, I can afford to go in and out of stocks until I catch the primary wave….

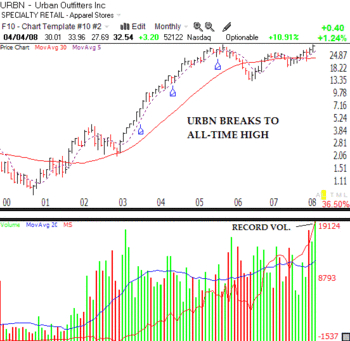
So I scanned the market for promising stocks and noticed that URBN, after rising 12x from 2003-2005, fell from grace in 2005 and went into a 3+ year consolidation.  Well, URBN appears to be coming back to life.  It is back on the IBD 100 list and has broken out to all-time highs on the highest volume since 1994.  I’ll tell you a secret. Urbn
One can often identify major break-outs by looking at a stock’s monthly chart.  On February 25, I wrote "I also like FDG, which this monthly chart indicates has
had a high volume break-out to a new all-time high, breaking its peak
from September 2005."   I said then that FDG looked like a long term cup-with-handle bullish pattern.  When I wrote that post, FDG had closed at $49.06.  It closed on Friday at $57.75.  URBN looks to me like it has a similar bullish pattern, as long as it can get above $34.  (Click on this monthly chart to enlarge.)  I have no idea whether this stock will perform as well as FDG.  But now that  it is  on the IBD 100 list in an up-trending market, I might be tempted to buy it and maybe even sell  covered calls on it…..