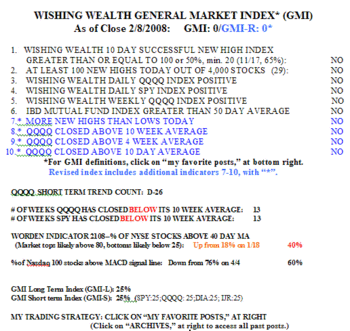
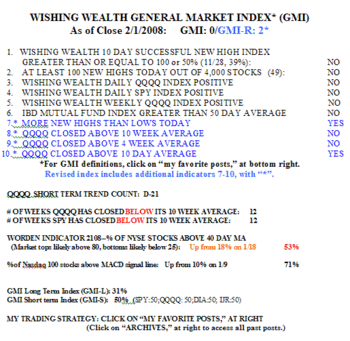
The GMI and GMI-R remain a t zero. Note that I made a small change to the 10 Day Successful New High Index.  This index looks at the number of stocks in my universe that hit a new 52 week high 10 days ago and counts how many of these closed today higher than on the day they hit the new high 10 days earlier. The idea is that in a strong market, stocks will continue to advance after hitting a new high. This indicator is positive if there are 100 successful 10-day new highs, or if not, if the percentage of these stocks that are higher is at least 50%. I have added the additional requirement that it be 50% and that there were at least 20 new highs 10 days ago (the denominator ge 20). I think that the 50% requirement is not enough if it is based on fewer than 20 stocks, as was the case last Friday (11/17)……
There were 29 new highs and 83 new lows in my universe of 4,000 stocks on Friday. The number of new lows is far below the numbers reached in January (as high as 1,453) and indicates that most stocks are holding above their January lows. It remains to be seen whether this relative strength will continue. Friday was the 26th day in the current QQQQ short term down-trend and the SPY and DIA have been below their 10 week averages for 13 weeks. The decline in the summer of 2006 lasted 13 weeks. But remember that a true bear market often lasts for 9-12 months. It just does not pay to try to anticipate the turn. It is less stressful on my money and my nerves to just wait on the sideline for a convincing turn. Contrary to what the pundits say, we will have plenty of time to jump on a real new up-trend. After the decline in the summer of 2006, the market pretty much remained in an up-trend for 15 months. So, why jump the gun? Swim with the tide.
Talking of swimming with the tide, the trend is still up in commodities and so there are a few commodity ETF’s that remain in an up-trend. DBC and DJP both broke to new highs on Friday. The only other ETF that hit a new high on Friday was DBA, which holds agricultural stocks, which have remained quite strong throughout the decline. If I were looking for the needle in the haystack stock or ETF to buy, I would start with these. Just remember, the bear typically devours everything, eventually.
