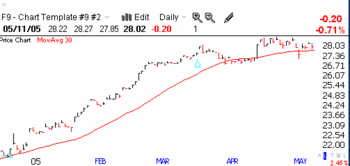
Today, the market disclosed again its schizoid tendencies. The tech stock index, as measured by the QQQQ, penetrated and closed above its 50 day moving average, while at the same time the large cap stocks, reflected in the SPY and DIA, broke down. This may be the most important signal in weeks regarding the probable direction of the market. Are we rotating from commodities to techs? Seventy percent of the the stocks in the NASDAQ 100 rose today, compared with 25% of the stocks in the S&P500 index, 30% of the stocks in the Dow Jones Industrial average and 25% of the stocks in the Dow Jones Transportation average.
The rise in the NASDAQ 100 today, therefore, cannot be attributed solely to the stellar performance of DELL (+7.4%). There was broad based buying in techs. The following 14 stocks in the NASDAQ 100 each climbed 3% or more today, in descending order of increase: DELL, ATYT, BRCM, NVLS, SANM, ORCL, SYMS, MRVL, EBAY, VRTS, FLEX, MXIM, KLAC and AMAT. Not all of these stocks are in solid uptrends, but it gives you an idea of the types of industries that moved the most today– semiconductors, software and circuit boards.
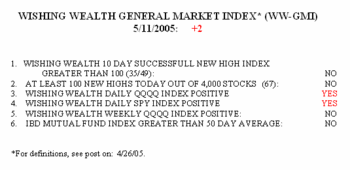
The WW-GMI stayed at +1, with one major difference, the Weekly QQQQ index is now close to positive.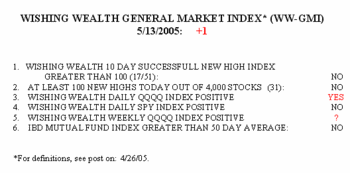 This weekly index, when it turns positive, indicates to me that a major uptrend has begun that typically lasts months, not days. We are not there yet, but I am now more optimistic. As would be expected from the discussion above, the Daily SPY Index is no longer positive, but with the Daily QQQQ Index turning positive, the GMI stayed the same at +1. I would not be surprised to see the IBD Mutual Fund Index turn positive next week if the QQQQ continues to rise. There were 17 successful 10 day new highs today and 100 successful 10 day new lows. There were 31 52-week new highs in my universe of 4,000 stocks and 123 new lows. These bearish statistics would not reflect the new strength in the tech stocks because these stocks would still be far from trading at new highs.
And then there is the Fed and interest rates.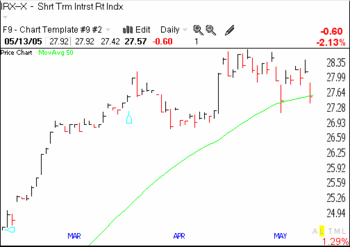 It appears that traders suspect at least a hiatus in the increases by the Fed. For the first time since April 19, 2004, the short term interest rate index closed below its 50 day moving average. Have you ever seen a less interest–ing development…..————————————————————————
My Ugly Stock of the Day yesterday, FDG, followed the script on Friday. FDG fell another 5.4% on its largest volume in a year. Is that because all of you sold/shorted it? Still, no bad news has come out on FDG, but its Industrial Metals and Minerals sector had a lot of losers today (MEE, ARS and PAL, were among the worst).—————————————————–
Tonight I have a Promising Stock of The Day that caught my attention a few weeks ago and moved up today.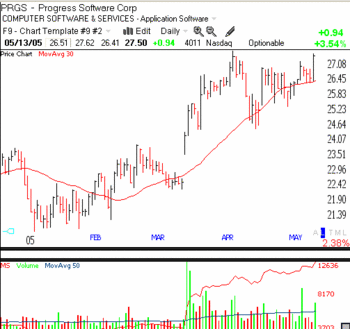 On March 17, PRGS gapped up on huge volume (a gap of 76 cents was created by the difference between the high price on 3/16 of 22.71, and the low price on 3/17 of 23.57). The stock climbed for a few weeks until it hit 27.73, and then began a decline back to its 30 day moving average. Note the many green spikes in up volume during the rise. Also note the nearly horizontal blue line in the volume section. This line tracks the 50 day moving average of volume. So, on days when the volume is above this line it can be viewed as relatively heavy volume for this stock. It is a sign of strength that almost all such higher volume days are up days (green).
The red line in the volume section is MoneyStream, a proprietary indicator in the Worden TC2005 software. MoneyStream is similar (but not identical) to the on-balance volume (OBV) indicator authored by Joe Granville. It is a form of a daily cumulative total based on price and volume. On up days, one adds all of a day’s volume to a cumulative total of volume, and on down days, one subtracts the day’s volume from the total. MoneyStream is therefore an indication of the strength of a move in terms of number of shares traded. In a rising stock, I want to see the MoneyStream at new peaks, indicating that the stock is rising on increasing volume. Clearly, PRGS fits this pattern.
PRGS settled down for a few weeks and then, what caught my attention was the spike in volume on May 9 when the stock rose, and closed at 27.05. Over the next 3 days the stock declined, but on relatively low volume. Then, on Friday, PRGS bounced off of its moving average and closed higher on above average volume. It closed at 27.50, just below its high for the day.
If I wanted to place a wager, I would make a pilot buy of 25 or 50 shares of the stock on Monday and place my sell stop right below today’s low, around 26.40. I would be willing to risk a loss of about $1.10 per share to hop on this potential rocket. I do not own PRGS, but may actually make this trade on Monday. (Another approach I sometimes use to avoid buying a stock that does not move up or declines, is to place a buy stop order just above the stock’s high of the day today, at 27.65. In this way I only purchase PRGS if it has the power to move higher than it did today. The downside is that I buy it a little higher and risk losing a little more-about $1.25/share- if it comes back down to trigger my automatic sell stop at 26.40.)
However, before I might buy PRGS, I would research it a little more. PRGS bottomed out in November, 2002 at $11.50, down from a historic peak of $30.75 in January, 2000. I usually like to buy a stock trading at its all time high, but will make an exception if it has been a few years since the stock’s historic peak. (If the stock peaked more recently, then there may be a lot of sellers waiting to unload their shares that they bought at higher levels, so they can get out even or with a small loss. Such overhead supply can slow or kill a stock’s rise.) PRGS has not doubled in the past year, but it recently broke through resistance around $24 which it repeatedly failed to get through for many months in 2003. I next turned to the Yahoo profile for PRGS. I found that in the most recent quarter the stock’s earnings doubled, from $4.6 million to $9.3 million–not too shabby. The industry is software, which I noted above was one of the strongest sectors today. The stock does not appear to have any eye catching visionary product. But it is earning more money.
I next go to Friday’s IBD and find that the EPS (earnings per share) ranking for PRGS is 77 and the RS (relative price strength) is 88. The IBD overall composite ranking is 91, indicating that the stock is ranked in the top 9% of all stocks, on a set of IBD criteria. These values are not as high as I would like, but they are still respectable. A most important benefit of IBD for me the past 20 years is that the newspaper uses a database that enables them to compare all stocks on a single percentile scale. William O’Neil, the publisher of IBD and a successful trader and author, has conducted an empirical analysis of the characteristics of growth stocks with the greatest appreciation which he summarizes in his CANSLIM approach. He has shown that many of these rockets had high RS and EPS, usually over 80, before they took off. So, I typically check these statistics before I buy a stock.
Now, we come to the art in trading. We have done our homework but each person will weight the findings differently. The science is over and the decision to buy is subjective–and involves some luck. I do know that if I am certain I am right about a stock, I usually am wrong. I typically make profits when I am somewhat anxious. I have to be sensitive to my gut and listen to my inner voice. I don’t have to agree with them, just be aware of how things turn out in the different ways I react. If I embrace the attitude that I will follow my rules and take small losses quickly, I can usually trade with a minimum of emotion and attention, and just let the transaction take care of itself.
So, will PRGS continue rising? No one knows, it probably depends largely on whether the tech stocks (measured by QQQQ) keep rising. There are no guarantees in the stock market. And even when I do everything right, the unexpected can and does occur. The only way I know to protect myself from this risk is to average up slowly, set sell stops after each purchase, and avoid placing all of my eggs in one basket.
But I don’t want too many eggs, either. If I pick real winners only about 30% of the time, the more I diversify equally into different stocks, the more I guarantee mediocre results. Gerald Loeb (1965, p. 119), in talking about diversification, said, "it is an admission of not knowing what to do, and an effort to strike an average."(This is why most mutual funds do not perform well. Those that do outperform tend to have a small number of stocks.) However, diversification is a necessary protective tool for new traders, and those who cannot pick good stocks. To make large profits, I need to concentrate the most money in the few winners I am fortunate to stumble upon.———————————————————-
This is my 23rd post. This blog has almost taken on a life of its own. I enjoy writing it and will continue to prepare it if the audience remains interested and grows. The only thing I ask in return, is that you help to build the audience. Please refer people whom you think my blog would entertain and inform. In addition, please send me your feedback at silentknight@wishingwealthblog.com. I strive to answer all emails and each of your messages makes a tremendous difference to me and helps to spur me on. Let me know if you have benefited from any of my Words of Wishdom.
Please remember that the stock market is a risky place, especially now. I am not providing recommendations for you to follow. My goal is to share tools and methods that I have used over the past 40 years of trading, so that you may learn from them and adapt them to your trading style and needs. While I do my best, I do not guarantee the accuracy of any statistics computed or any resources linked to my blog. Please consult with your financial adviser and a mental health practitioner before you enter the stock market, and please do not take unaffordable risks in the current market environment. See the About section for more statements designed to protect you (and me) as you navigate this market. Past performance does not guarantee future results, but I would rather learn from a former winner than a loser.
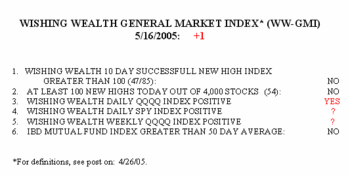 The successful 10 day new high index climbed to 47, the highest since last April 6. Moreover, 55% (47/85) of the stocks that hit a new high 10 days ago closed higher today than 10 days ago. There were only 31 successful new lows–only 40% of the new lows 10 days ago closed lower today than 10 days ago. Thus, a trader betting on new highs 10 days ago has had a better chance of succeeding than a trader shorting new lows.
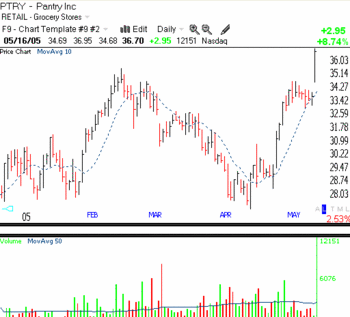 PTRY topped out at 35.60 on February 17. It then began a decline to 27.33 on April 18. It next began a rise to 34.77 and reacted back to its 10 day moving average (dotted line). Today it broke to a new high and closed at 36.70 on the highest volume since last October. (The horizontal blue line reflects the 50 day moving average of volume.) PTRY produced a gap of .65 between Friday’s high of 34.03 and Monday’s low of 34.68.


