I started teaching two classes on technical analysis last week and will explain more of my concepts and include informational links, as many students will be new readers. My General Market Index (GMI) keeps me trading with the general market’s trend. The GMI is a count of 6 short and long term indicators. Because I like to trade growth stocks, the GMI focuses largely on the NASDAQ 100 stocks, as measured by the ETF, QQQQ. The Successful New High Index measures whether stocks that hit a new high 10 days ago have risen since that time. Since I trade stocks at or near new highs, I also like there to be at least 100 new highs in my stock universe of roughly 4,000 actively traded stocks above $5. My daily QQQQ and SPY indicators measure these indexes’ short term trends. The weekly QQQQ indicator is my measure of the longer term trend. Weekly charts provide me with a more interpretable and reliable picture of the market’s trend. Finally, my IBD Mutual Fund Index indicator tells me how well growth funds tracked by IBD are doing. If funds that invest in growth stocks are doing well, I am also more likely to make money trading growth stocks. I subsequently added four more indicators to the GMI in the form of the GMI-R (revised). The added indicators count whether there are more daily new highs than lows, and how the QQQQ has performed in relation to three moving averages. I become very defensive in my trading portfolio when the GMI is less than 4 and consider going to cash. When the GMI goes to zero, I also start going to cash in my more conservative university pension account, which allows me to trade its contents only a few times each year. So, with the GMI currently at 1,
ETF
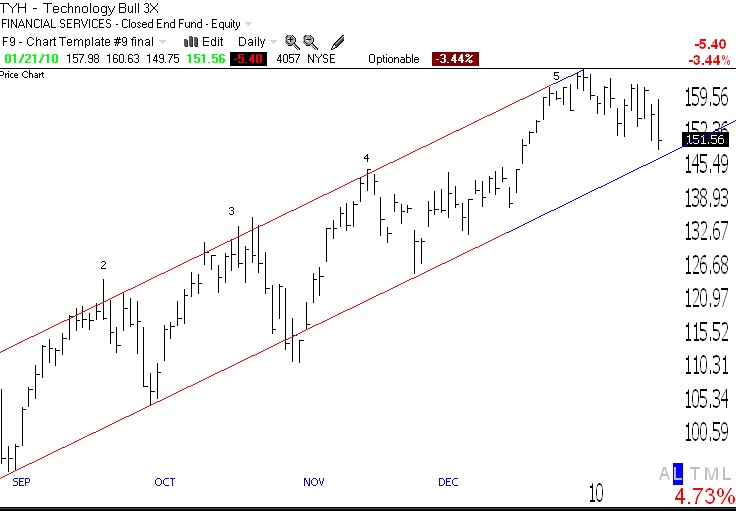
Tech Stocks Decline, Will Channel Hold?
Thus far, tech stocks, as measured by the ultra 3X ETF, TYH, are declining within the channel I have been watching for several weeks. The question, which my stock buddy, Judy, raised when I first posted the channel was, will the bottom of the channel hold as it has in the past? No one knows. The key for me is to wait for the reversal, and to then wade in slowly, with stops below the low of the bounce. Meanwhile, the Worden T2108 Indicator is now in neutral territory, at 58%. Only 19% of the NASDAQ 100 stocks have a MACD that is above its signal line, the lowest percentage since last November’s decline. The low in this indicator last November was 9%. The key for me is to remain defensive, and to cut losses before they grow too large.
NASDAQ 100 Index Still in Up-trend; QLD and TYH beat most NASDAQ 100 stocks again!
The GMI is still at 6 although the more sensitive GMI-R has declined to 8. Still, there were 185 new highs in my universe of 4,000 stocks on Friday. 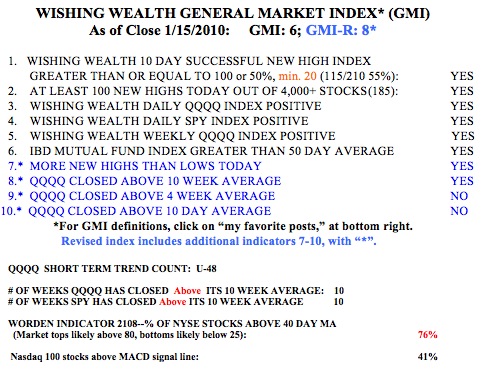 The Worden T2108 Indicator is now at 76%, within neutral territory and down from the high of 84% last week. But only 41% of the Nasdaq 100 stocks had their MACD above their signal line, reflecting the weakness in tech stocks. Still, the SPY and QQQQ have closed above their 10 week averages for 10 weeks. During that time, the QQQQ increased +11%, QLD by +23% and TYH by +36%. The TYH beat all but 3 of the Nasdaq 100 stocks and QLD beat all but 12 of them. I repeatedly learn the virtue of just holding the QLD or TYH ETF’s rather than trying to find the few individual stocks that beat these amazing ultra ETF’s.