Google rockets on; Funds to time the market; BOOM-cup with handle; GMI–+5

Well, this market is really moving.  Did you see GOOG’s $13+ rise today?  Honest, I had no idea when I wrote Sunday’s post.  Cramer is shouting– BUY GOOGLE!!!  He obviously had this one right.
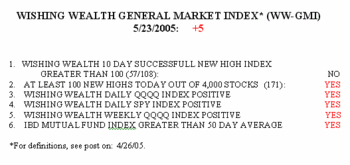
  Gmi523 The GMI is solid at +5.  This reading does not mean that we won’t have declines–only that the current trend is up.  These indicators have gotten me out of every major market decline since 98, and I will let you know when I begin to get defensive.  (Remember, past performance does not guarantee future results and blah, blah blah…)  Right now things could not look much better to me.  There were 171 new 52 week highs in my universe of 4,000 active stocks, and only 17 new lows.  Let’s say it again: there were ten times as many new highs than new lows today!  What a turn around in just a couple of weeks.  Today, 53% of the NASDAQ 100 stocks rose, 70% of the Dow 30 and 65% of the S&P 500 stocks.  These numbers are good, but not as strong as a few days ago when we saw 70% or more of the stocks in all of these indexes rising.  So, we are getting a little weakening, which is a good thing. We want a market with some backing and filling so this rise will last a while.

I moved my 401(k) funds from the money market fund to equities about a week ago.  Most mutual fund families allow a limited amount of transfers between funds.  Did you know, however, that there are at least 2 mutual fund families that are designed to allow you to time the market?  If you are good at trading the market indexes, you owe it to yourself to check out the Rydex Funds and the ProFunds.  These funds allow daily trading back and forth in a variety of index and sector funds.  In fact, you can buy funds that move with or opposite to an index, so you can profit from a decline in an index if you are bearish.  Better still, some of their funds are leveraged so that they move twice as much as the indices they  track.  So, if you have the minumum ($15,000 for ProFunds) to open an account and you want to take a bullish or bearish position on the market, these funds may be the way to go. You could also open an IRA in one of these funds.  Read the prospectus carefully and note each fund’s management fees.

I have been meaning to tell you that JNJ is looking sick.  The chart shows high volume selling last week and it only managed a small gain today.  Is the stock telling us something?

BOOM looks like a high volume breakout today–cup and handle?  (I own a few shares of BOOM).Boom The cup with handle pattern was made famous by William O’Neil and his newspaper, IBD. Note the huge rise in BOOM from under $10 to almost $39.  Then it entered a 3 month base.  It formed the top of the right side of the cup on May 10 at 35.18.  Note the huge gap up on high volume to build the right side of the cup.  Today BOOM burst through the top of the handle on volume that was far above its 50 day moving average (blue horizontal line) and closed at 37.64.  The IBD ratings for BOOM are:  Overall–94; RS-99, EPS-89.  Thus, according to the IBD criteria this company ranks in the top 4% of all stocks, with a relative (technical) strength rating in the top 1% and earnings per share rating in the top 11% of all companies.
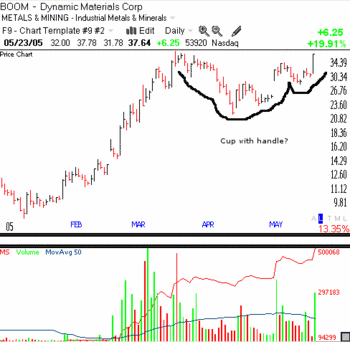
I already own this stock.  How would I play it if I did not?  I might make a small pilot buy tomorrow and place an immediate sell stop below today’s low at around 31.75.  Alternatively, I might place a buy stop at 39 to purchase a small number of shares it if it breaks through to an all time new high. In that case I might then place a sell stop closer to the breakout point.  In a true breakout, the stock should not come back down below the prior peak.

Other strong stocks to watch include:  SNHY, CLHB, BEBE and of course, HANS.  There are so many more.

Send me your feedback at silentknight@wishingwealthblog.com

Please remember that the stock market is a risky place, especially now.  I am not providing recommendations for you to follow.  My goal is to share tools and methods that I have used over the past 40 years of trading, so that you may learn from them and adapt them to your trading style and needs.  While I do my best, I do not guarantee the accuracy of any statistics computed or any resources linked to my blog.  Please consult with your financial adviser and a mental health practitioner before you enter the stock market,  and please do not take unaffordable risks in the current market environment.  See the About section for more statements designed to protect you (and me) as you navigate this market. Past performance does not guarantee future results, but I would rather learn from a former winner than a loser.
GMI hits 4+

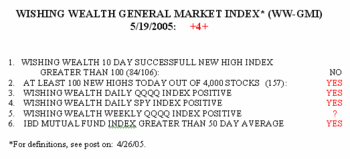
The WW-GMI hit 4+ today.  The IBD Mutual Fund Index finallyGmi519  closed above its 50 day moving average, indicating that growth mutual funds are climbing.  The Weekly QQQQ Index is borderline positive.   There were 86 successful 10 day new highs. (See 4/26 post for elements of the GMI)  In fact more than 80% of the 106 stocks that hit new highs 10 days ago closed higher today than 10 days ago.   There were also 157 new highs today and only 31 new lows. Seventy percent of the NASDAQ 100 stocks rose today, 62% of the S&P500 stocks and 60% of the Dow 30 stocks. This market rally is firing on all cylinders.

Last week I transferred all of my 401-k funds from money market funds to equity funds.  Over the past 7 years I have succeeded in avoiding all serious market declines by being in cash.  There is no necessity to take a buy and hold approach with company 401-k plans. Most fund families allow you to switch funds a limited number of times.  In October, 2000, I sold out my growth funds around 103 and watched them drop to below 40.  I hope my timing is correct this time.

Even though I think the trend is up, I religiously place sell stops below every purchase.  We can never take the market for granted.  This weekend I will return to strategy. Next Wednesday is the IBD meetup.

Send me your feedback at silentknight@wishingwealthblog.com

Please remember that the stock market is a risky place, especially now.  I am not providing recommendations for you to follow.  My goal is to share tools and methods that I have used over the past 40 years of trading, so that you may learn from them and adapt them to your trading style and needs.  While I do my best, I do not guarantee the accuracy of any statistics computed or any resources linked to my blog.  Please consult with your financial adviser and a mental health practitioner before you enter the stock market,  and please do not take unaffordable risks in the current market environment.  See the About section for more statements designed to protect you (and me) as you navigate this market. Past performance does not guarantee future results, but I would rather learn from a former winner than a loser.
Livermore on profits, Cramer on sleepers and 15 Hot Stocks–WW-GMI: +3+

In explaining to Walter Chrysler (yes, THE man) why it was a mistake when he, Livermore, took a profit too soon in a trade, Jesse said:

"You remember that old joke about the guy who goes to the race track and bets on the daily double and wins, then takes all his winnings and bets it on the third race and wins. He does the same on all the other races, and wins.  Then on the eighth and final race, he takes his hundred thousand dollars in winnings and bets it all to win on a horse, and the horse loses.

Well, he’s walking out of the track and he meets a pal of his, who says, ‘How’d you do today?’

‘Not bad,’ he answers, smiling.  ‘I lost two bucks.’ " (the money he started with)

     Jesse Livermore, World’s Greatest Stock Trader, by Richard Smitten, 2001, p. 226

Livermore was saying he made a mistake by selling when he had a profit because he was scared of losing the money he had made.  He should not have been scared, however, because he was playing with the track’s money (the profits) and was not risking the money he started with.  Fear was not a valid reason for selling, the only good reason to exit a profitable trade, according to Livermore, is a technical signal resulting from the stock’s behavior.

One of the reasons that Jesse Livermore made (and lost) several fortunes in the market was that he averaged up on profitable trades and was not afraid to risk his profits.  Risking your capital, however, was suicide for a trader. This approach is similar to the one espoused by Loeb when he said to slowly average up as the trade worked out.  That way, you would not risk much of your original money.

Today, Jim Cramer espoused a strategy that was as antithetical as possible from the way the great traders (see book by John Boik) operated.  Cramer said to look for stocks that have not moved up, the sleepers, and to buy them because they would be more bullet proof in a possible decline.  Remember the quote from Crane that I posted a while ago saying that buy signals were simply evidence that a stock was already being bought by others?  Both Livermore and O’Neil  and Darvas talk about buying stocks that have demonstrated strength by bursting to new highs on unusual volume.  Why would anyone attempt to seek winners by finding stocks that are not moving in a rally!  (Now I can surmise why Cramer has said his wife, The Trading Goddess, had to rescue his hedge fund several times.) We already talked about not buying rockets that are sitting on the launch pad–they may never take off. The gurus I listen to have written that the big money is to be made in buying the leading stocks–the ones that burst to new highs as soon as the market gains strength.

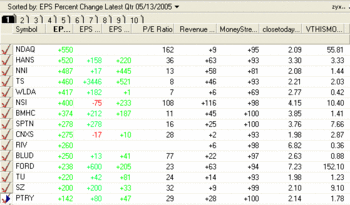
So, I decided to run a scan using TC2005, to find all  stocks (in my universe of 4,000) that hit a new 52 week high in the past 10 days.  I found 371 stocks.  I then ranked them by EPS gain in the past quarter and excluded all stocks with less than a 100% gain in earnings, that had not at least doubled in the past year and that were not trading near all time highs. Tc2000 The matrix shown here (click on it to enlarge) presents the 15 stocks that survived my screen, ranked by earnings gain the past quarter (the first EPS column).  The second EPS column is the increase in earnings 2 quarters ago, and the last EPS column is the increase over the past year.  An interesting characteristic of these stocks is that the PE (price divided by earnings per share) ratios are all below their earnings growth rates. This may be symptomatic of a market that has not yet bid up growth stocks to astronomical levels. The revenue column is revenue growth over the last 4 quarters.  The next column presents MoneyStream, the Worden TC2005 indicator similar to on-balance volume I described a few posts ago.  The next column shows the price today divided by the price 250 days ago, and the final column shows the volume this month divided by the volume 6 months ago.  A  rocket often has extraordinary increases in volume as it rises.

Not all of these stocks are buys.  However, I wanted to show you an effective way of screening powerful stocks and a way to present the information so it is easy to obtain a snapshot of some important fundamental and technical indicators by which to compare stocks. Of course, I want to buy such strong stocks only if the market is rising—-like now!!

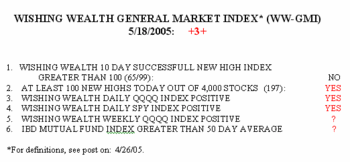
The market keeps growing stronger.  The GMI is +3+.  It is probably Gmi518_1 really a 4, because the IBD Mutual Fund Index was very close to its 50 day average as of this morning’s edition and the index probably broke above it with today’s advance.  When this index turns positive, it indicates that the mutual funds that concentrate in growth stocks are beginning to do well and augurs well for those of us who buy growth stocks.  There were 197 new 52 week highs in my universe of almost 4,000 stocks and only 30 new lows.  There were 65 successful 10 day highs and only 16 successful 10 day lows.  Increases occurred in 84% of the NASDAQ 100 stocks, 80% of the S+P500 stocks, and 87% of the DOW 30 stocks.

Right now the trend is up—finally.  Another sign of the turn is that some of my trader friends have abandoned the market and thrown in the towel on trading. Those of us who went short or stayed in cash these past difficult months can now take advantage of the bull trend. There is a time for every season…….

Send me your feedback at silentknight@wishingwealthblog.com

Please remember that the stock market is a risky place, especially now.  I am not providing recommendations for you to follow.  My goal is to share tools and methods that I have used over the past 40 years of trading, so that you may learn from them and adapt them to your trading style and needs.  While I do my best, I do not guarantee the accuracy of any statistics computed or any resources linked to my blog.  Please consult with your financial adviser and a mental health practitioner before you enter the stock market,  and please do not take unaffordable risks in the current market environment.  See the About section for more statements designed to protect you (and me) as you navigate this market. Past performance does not guarantee future results, but I would rather learn from a former winner than a loser.