GMI: 0; GMI-R: 0; 16th day of the down-trend; A great new book on the Turtles

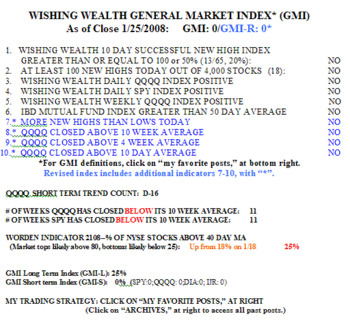
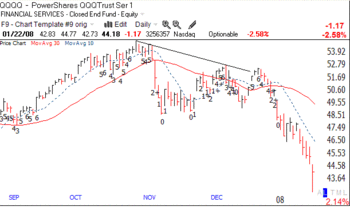
Both the GMI and GMI-R remain at zero.  Gmi0128 There were 18 new highs and 45 new lows in my universe of 4,000 stocks on Friday.  Only two (PRXL, ISYS) of the 509 stocks on the IBD100 lists I tracked the past year hit a new 52 week high on Friday.  Growth stocks are just not climbing to new highs.  There is no reason to be long growth stocks in this market unless I just want to gamble and try to fight the tide.  Friday was the 16th day (D-16) of the current QQQQ short term down-trend.  While my most sensitive daily indicators are off of the extreme low values they hit early last week, none of my indicators have turned positive. Trend followers catch the up-trend after it has developed.  I am content to wait for a true bottom and a subsequent up-turn before I wade back into this market.  Many of the bear markets I have witnessed back to the 70’s continued for nine months or more.  We are only a little more than two months into the current decline…….
Over the past 40 years, I have rarely found a book on trading that made a significant difference to my approach to trading.  I have listed those few books to the lower right of this page. (I earn no money off of any sales of the books I mention and receive no income from this blog.)   Well, I recently read a book that I will list with the others.  Michael Covel’s new book, "The Complete Turtle Trader," is a masterpiece in describing the trading philosophy and rules used to train the famous Turtles, who learned how to make millions trading, in a two week course taught to them by Richard Dennis and William Eckhardt in the 80’s.  The most important thing I learned from this book was the mentors’ primary emphasis on exits from a trade rather than entry.  Dennis is quoted as basically saying one might profit by selecting positions by trial and error as long as one had a good exit strategy.  Go into every trade as if you will lose money and you will be prepared in advance for that possibility and limit your losses. Don’t take my word for this, read the book.  The turtles used an extremely systematic and innovative set of rules to trade futures, which I think can be adapted for trading equities.  This is a good time to be out of the market, to analyze one’s prior trading performance and to, perhaps, read a great book….
Newdisclaimer

GMI: 0; GMI-R: 0; 1,453 new lows; safely in cash– and patient

The GMI and GMI-R remain at zero.  The GMI flashed a sell signal at 2+ on January 2 and has remained at zero since January 4.  Gmiperf0122 (Click on chart to enlarge.) There were 1,453 new lows and 24 new highs in my universe of 4,000 stocks on Tuesday.  The percentage of Nasdaq 100 stocks closing above their 30 day averages is now 5%.  The Worden T2108 fell one to 18%.  Tuesday was the 13th day of the current QQQQ down-trend.  Only 13% of the stocks in my universe closed above their 10 week averages.  Some of these readings are the lowest I have seen in the past three years.

When I began this blog in 2005 I wrote that I was a chicken and had successfully avoided all significant market declines since 1995.  It appears that my indicators have kept me out again.  While I do not make recommendations on this blog I did tell you when I went to cash in my pension plan and in my trading IRA.  I hope that many of you looked at my indicators and also took actions to protect your funds.  The market signaled this decline weeks ago and if we heeded its warnings and ignored most of the "stay invested" media pundits it was possible to emerge unscathed.

The market will signal a bottom at some point and it is critical to concentrate on its behavior.  The trick is to wait for the turn and to wade in slowly.  Anticipating bottoms is a fruitless exercise.  I am very willing to miss quick short-term bounces and to wait for the signs of a real change in trend. When the GMI returns to 3 or 4 and the QQQQ is in an up-trend there will be ample time for me to profit from the rise.  In 2003 after the bear market my account gained over 50% in the market rise, without margin (not allowed in an IRA) or the use of options.  I have learned over the past 40 years that the secret of success is to be in the market (on the long side) only when the market is in a confirmed up-trend. So I will remain in cash now and monitor the IBD100 stocks for possible future leaders. (See yesterday’s post.)  As Jesse Livermore once said, the most money is made in the sitting, not in the trading…..

See my disclaimers at the bottom of yesterday’s post.

GMI: 0; GMI-R: 0; 12th day of down-trend, sucker rally near?; IBD100 holds winners

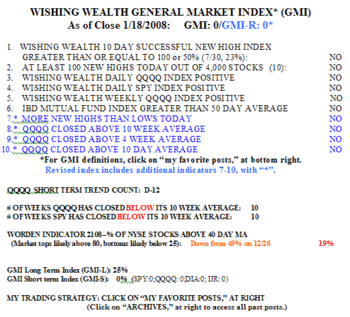
The GMI and GMI-R have been zero since January 4.   On Friday there were 844 new lows and just 10 new highs in my universe of 4,000 stocks. Gmi0118 This number was exceeded only by the 1,011 lows on January 9.   It was also the fewest number of new highs since August 28, near the lows of last summer’s decline.   Friday was the 12th day in the current QQQQ short term down-trend.   However, note that the QQQQ and SPY have closed below their 10 week averages for ten weeks.   I have written before that when these major indexes are below their ten week averages I rarely make money going long.   In fact, since November 8, when the QQQQ first closed below its 10 week average, the QQQQ has declined 12% and 82% of its 100 component stocks closed lower on Friday than on November 8; only 13% have advanced 1% or more.   During the same period 87% of the S&P500 stocks have declined. Can you see why it makes no sense to fight such odds?

So where do things stand now? It will take a long time for the indexes to rise above the critical moving averages I monitor. Nevertheless, the Worden T2108 indicator is in possible bottom territory at 19%.     And the averages are in an almost vertical decline.   These conditions may portend a bounce, especially with the Fed likely to act soon.   It doesn’t pay to fight the Fed.   The safest route, the one that lets me sleep at night, is the solution I quoted from Nicolas Darvas several posts ago–stay on the sideline and wait for the inevitable rise from the ashes, whenever that comes.   The odds of benefiting from a rally are much greater when the QQQQ is above its 10 week average, currently at 49.81, versus its close Friday at 45.35.   In other words , a rally would have to exceed about +10% for me to call a change in trend.   There is clearly a lot of room on the up-side for failed, sucker rallies.

Until the turn comes, I am keeping a watchlist of stocks that have resisted the decline.   I scan the IBD100 stocks for those close to their all-time highs and in an up-trend.   I let IBD do the tough work of ranking all stocks by fundamental and technical strength.   I then can focus on the top 100 stocks that they have identified.   Some skeptics have told me that the IBD100 list identifies winners too late.   Well, according to my sample of monthly lists of IBD100 stocks over the past two years, I found the following 2007 leaders showed up on at least one IBD100 stock list:   ISRG: 8/2007, 199.13 (high after this date: 339.63); AAPL: 10/2006, 54.44 (202.96); GOOG: 10/2005, 310.65 (747.24); BIDU:   5/2007, 131.99 (235.28); GRMN: 10/2006, 47.93 (125.68) .   If I had a complete list of the IBD 100 lists over the past years, I might find that some of these leaders were identified even earlier.

Now, I am not saying that all stocks that appear on the IBD100 list do well, they do not.   But I use the list as a starting point to find stocks that meet my technical specifications, with the comfort that the list contains the best stocks in the market, according to IBD’s systematic technical and fundamental criteria.   Stocks that weaken are quickly dropped from the list published each week by IBD.   Even in this declining market there are stocks on the IBD100 lists that are resisting the current down-trend.   I use TC2007 to find these stocks and to create a watchlist that may contain market leaders once the market turns.   The key is to wait for the turn and not to be seduced into them now when false moves are very likely.   Some of the 26 stocks that I am watching are:   HMSY, VIVO and SRCL.   Take a look at monthly and weekly charts of these stocks to get an idea of the types of technical patterns that I think are promising for purchasing a stock AFTER the beginning of an up-trend in the QQQQ.

Newdisclaimer