On Saturday, I had the honor of speaking before the Virginia AAII Computerized Investing SIG. I spoke about my technical analysis course at the University of Maryland and my trading strategy. I presented a lot of material which I included in my Worden webinar. For those who missed Saturday’s session or would like to review my material, please go to www.worden.com and scroll down to the webinar, “A word from the professor.” I think that Saturday’s session went well and I was pleased to see that most attendees said they would enroll in a future workshop, if I should arrange one. If anyone who was there would like my oversold stochastic followed by a buy signal PCF, please email me at: silenknight@wishingwealthblog.com
Meanwhile, the GMI is still at 5 (of 6), with only my Weekly QQQQ trend indicator remaining negative. 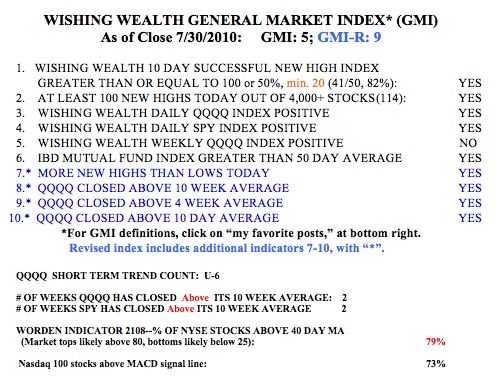 The short term trend of the QQQQ remains up and has just passed its 6th day. The QQQQ and SPY ETF’s have closed above their critical 10 week averages for two weeks. I tend to make money trading on the long side only when these indexes close above their 10 week averages. The Worden T2108 Indicator is at 79%, near overbought territory, where it can often remain for months. Finally, 73% of the Nasdaq 100 stocks have a MACD above its signal line, a sign of near term strength.
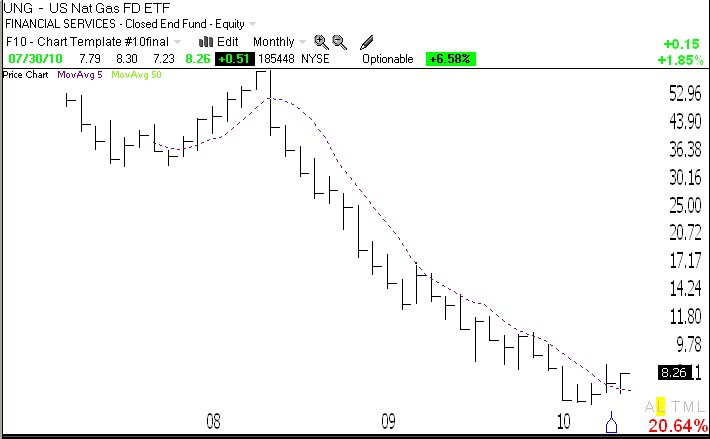
With the Weekly QQQQ Index still negative, I am reticent to commit to the long side of the market. I therefore remain heavily in cash. However, as I wrote on Friday, I think that UNG may be bottoming and I have a long position in this natural gas ETF. I usually only buy stocks at all-time highs. Commodities are different, however, because they have a true value. Natural gas is not likely to go to zero. I therefore think that commodities go back and forth between oversold and overbought. Since UNG seems to me to be forming a bottom after a tremendous decline, I am willing to place a small bullish bet on it. It recently gave me a buy signal after hitting extreme lows on its stochastic indicator. If I am right and UNG continues to strengthen, I will add to my position. Below is a monthly chart of UNG. (click on chart to enlarge.) UNG has closed above its 5 month moving average (dotted line) for the first time since the decline began in July, 2008.
From BusinessWeek:
U.S. Natural Gas (UNG), got so big last year that at its peak it owned the equivalent of 86 percent of the near-month natural gas contracts on the Nymex. As natural gas prices fell into the basement—traders call the notoriously volatile market “The Widowmaker”—UNG fell with them, and when gas prices rallied, UNG did not. The fund’s growth raised concerns among regulators at the CFTC, which last year began debating position limits; it will revisit the issue this year. The fund grew so large it had to freeze its position and start buying over-the-counter derivatives—unregulated contracts tied to gas prices—instead of futures.
http://www.businessweek.com/magazine/content/10_31/b4189050970461_page_7.htm
Dr Wish,
I enjoyed your webinar–excellent information by the way.
Very simple question–when you refer to moving averages, are you using simple or exponential?
MACD uses exponential. However, my trend averages are all simple averages. But use your own judgment by applying each and seeing which one works best for your rules and stocks.
LCC looks like it has just broken into a stage 2, just initiated a pilot buy. By the way, can I get the updated PCF for the stoichastic.
Thanks
Christopher Papanicolas