With the GMI and GMI-R at their maximum values, I am invested long in my university pension and my trading IRA. Friday was the 34th day of the current QQQQ short term up-trend. In the recent past, up-trends have lasted as long as 80 days. 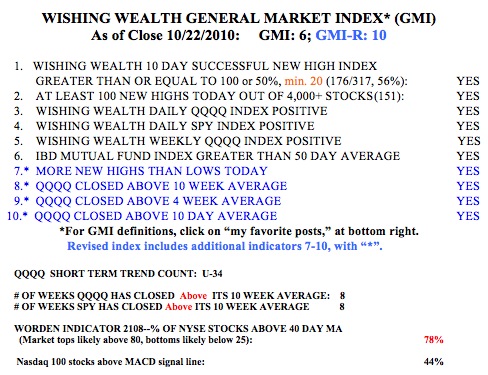
Month: October 2010
Beware of Gold, looking at DZZ
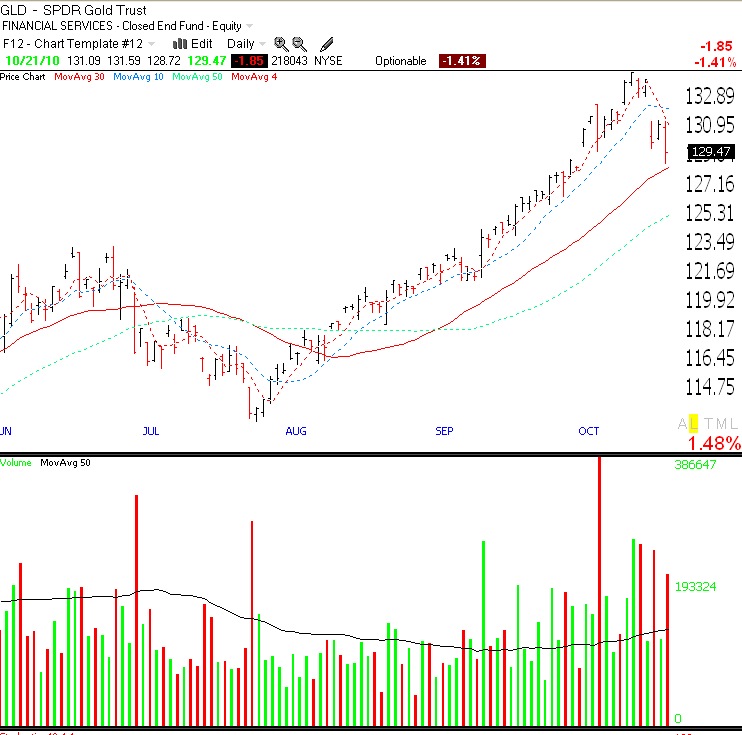
For the first time since last July/August, the gold chart looks ominous (see daily chart of GLD below). The 4 day average (red dotted line) has now crossed below the 10 day moving average (blue dotted line). GLD gapped down on huge volume 3 days ago and it has had 3 big volume down days (red spikes) since then. My perspicacious stock buddy, Judy, exited GLD (the gold ETF) 2 weeks ago after buying in around $70 in 2008. GLD has also now closed below its 4 week average, after having traded above this average since last summer. The long term support for GLD has been at its 30 week average since early 2009 and it is far above that now. If I were to bet on a short term down-trend in GLD, I would buy the double short ETN, DZZ. I would wait for a close of GLD below its 30 day average (solid red line), currently at $128.50. However, as long as GLD remains above its 30 week average, it remains in a Stage 2 long term up-trend.
Up-trend completes 32nd day; TYH beats most stocks again; RWB stock: NTAP
Wednesday was the 32nd day of the current QQQQ short term up-trend. During this up-trend, QQQ has risen 12%, QLD +25.5% and TYH +38%. TYH beat all of the stocks I have been trading, including AAPL +20% and GOOG +31%, yet again showing that riding the 3X ultra tech ETF, TYH, during a QQQQ up-trend beats most individual stocks. The ETF that has risen the most is CZM, China bull 3X, up +45%.
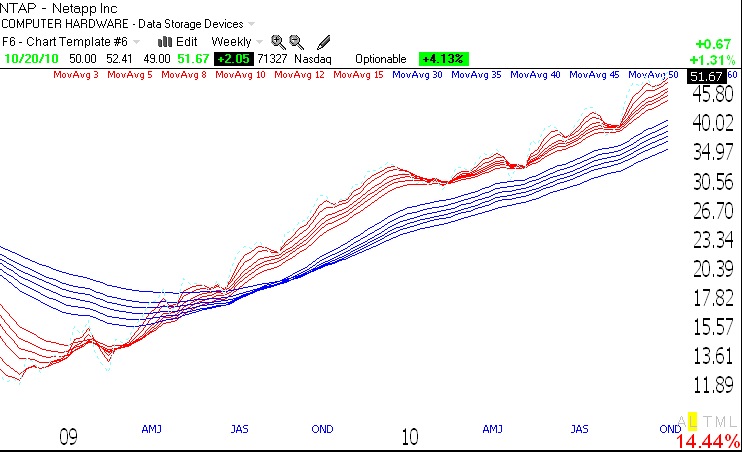
The GMI and GMI-R snapped back to their maximum values on Wednesday. NTAP (weekly chart below, click on to enlarge) is another RWB rocket stock (red short term averages well above blue longer term averages) that hit a 52 week high on Wednesday–I own Dec call options on it. Earnings are due Nov 17. By the way, NTAP is on my cumulative IBD 100/ New America watch list. All of the stocks I buy have therefore already passed the IBD CAN SLIM stringent fundamental and technical criteria.