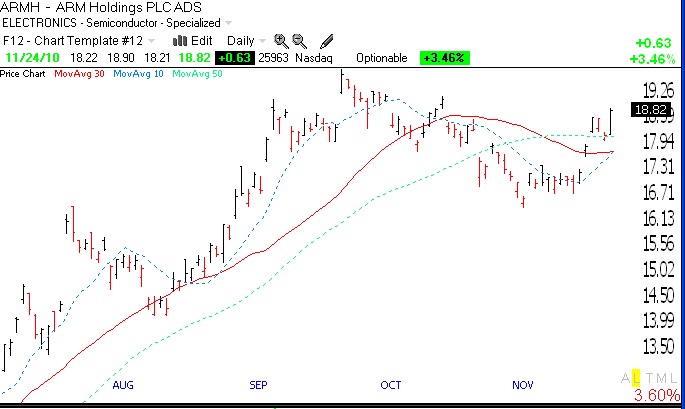
I have to relearn the lesson from time-to-time that I should not try to anticipate a change in trend, but to wait for the signal. Just when it looked like the new QQQQ short term up-trend would expire, it reasserted itself. Generally, if a new up-trend can reach 5 days, it has legs to continue. And so the leaders took off again. Leading stocks like AAPL, AMZN, TTM, APKT, CAVM, CTXS, RVBD, HANS and FFIV all advanced nicely. I own some of these. I am also keeping an eye on ARMH. ARMH looks like it may have completed its consolidation. Take a look at this daily chart (click on to enlarge). ARMH broke above its 50 day average (green dotted line) and its 30 day average (red line), and the 10 day average (blue dotted line) is rising above the 30 day.
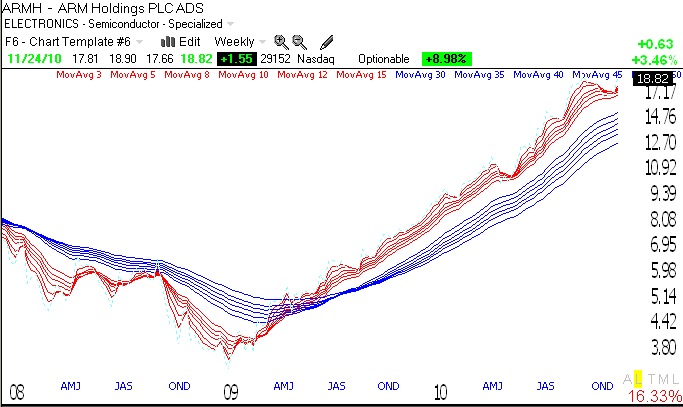
Note also that the GMMA weekly chart below shows the RWB pattern typical of rocket stocks. The short term averages (red) are well above the rising long term averages (blue). I only buy stocks that have monthly, weekly AND daily up-trends in place.
 I am keeping an eye on ARMH.
Well, trend is your friend, just wait to prove itself I guess!
Jim
is there anyway you can get mini charts or have the expand out from your “stocks im watching” list when you scroll over them? would you son be able to code that?
I suggest you go to freestockcharts.com to review any stock you are interested in.