I have replaced the GMI-R that combined the 6 indicators from the GMI with 4 additional indicator. The new GMI2 contains the 4 indicators from the GMI-R and adds two additional indicators. The GMI and the GMI2 will each count 6 different indicators. I have GMI statistics for several years and have found it to be very useful fro keeping me on the correct side of the general market’s trend. I like to be long if the GMI is 4 or more. When it declines to 3 or below, I get defensive in my trading IRA. I use the GMI2 to alert me to changes in key market indicators I like to monitor. I do not have decision rules based in the GMI-R or the new GMI2. In severe down-trend both sets of indicators will register zero.
I publish this table every Monday morning. 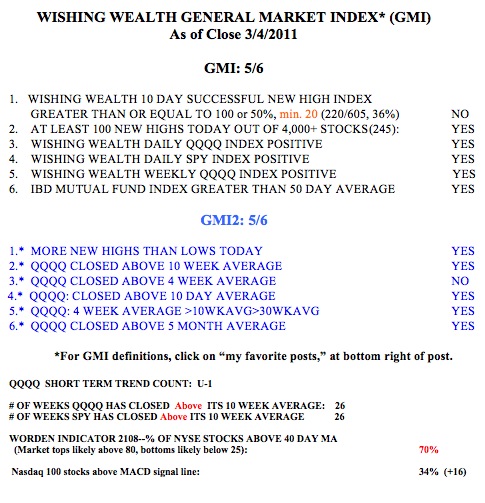 Click on the table to enlarge. My short term trend count for the QQQQ Nasdaq 100 index) is up again, at U-1. Since the large short term up-trend ended at U-64, there have been 3 small trends (D-3, U-2,D-2), and now the new up-trend. So, I have been whip-sawed a little in my trading accounts. But my longer term university pension money remains fully invested long in mutual funds. The longer term (weekly) trend of the SPY (S&P 500) and QQQQ ETF’s (exchange traded funds) completed their 26th week. The Worden T2108 indicator is at 70%, in high neutral territory. Readings around 80% tend to occur at short term market tops. On Friday, 34% of the Nasdaq 100 stocks closed with their MACD indicator above its signal line, up from 18% last Friday and a sign of growing short term technical strength…..
As many of you know, I rely on the TC2007 charting program to calculate all of my statistics and to scan for promising stocks. This weekend I attended the Worden workshop on their new version of the program, TC2000. This program is internet based and can be accessed from any computer (including Macs) via the internet. It combines most of the qualities of TC2007 and freestockcharts.com. I really like it. I encourage people to introduce themselves to the Worden platforms by going to their free charting site, www.freestockcharts.com, and if you like the look into www.tc2000.com if you want advanced scanning and alerts capabilities. I will be switching to the new platform soon and will do another webinar for them using TC2000, in the fall….
I often select stocks to buy from the IBD50 list (formerly the IBD100). Every Monday, IBD publishes a list of the 50 tops stocks, according to their excellent fundamental and technical criteria. I thought I would revisit the issue of how well the IBD50 stock list has performed in the recent past. I am looking at the list published on Monday, 2/14. I therefore track the performance from the closing prices on the previous Friday (2/11), through the close on March 4. During that period, the Nasdaq 100 index ETF, QQQQ, declined a little less than 1%. So, how did the IBD50 stocks do? A little less than one half, 48%, advanced. 18% advanced 5% or more, and 8% advanced 10% or more. The top three stocks were SLW (+31%), ARUN (+24%) and EBIX (+18%). During the same period, 44% of the NASDAQ 100 stocks rose, 12% rose 5% or more, and 2% rose 10% or more. The top three gainers were VRTX (+33%), DELL (+12%) and KLAC (+9%). So, it looks like the IBD50 stocks performed somewhat better than the Nasdaq 100 stocks during this time period when the QQQQ declined a little.
If one instead had purchased the leveraged bullish QQQQ ETF’s during this period, one would have underperformed the QQQQ: QLD (-1.9%) and TQQQ (-3%). For the first time that I have done this type of analysis, the leveraged ETF’s failed to outperform the other strategies. Only 30 of the NASDAQ100 stocks fell 3% or more during this period, and 42% fell 2% or more. Thus, it appears to me that buying the leveraged QQQQ ETF’s is more likely to be a winning strategy only if the QQQQ advances during that period. Moral of the story, if I buy a leveraged bullish ETF and the underlying index begins to decline, I better exit quickly…
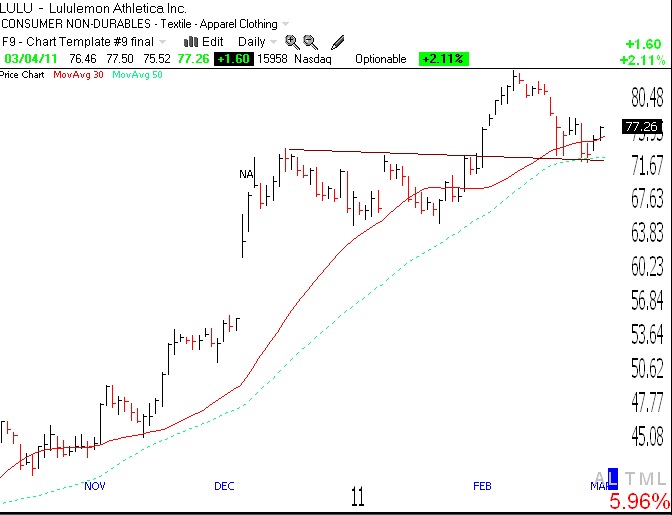
LULU came up on my daily scan again. This daily chart shows that LULU appears to have retraced back to its break-out point (at horizontal line, 50 day average (green dots) and 30 day average, red line). It will be interesting to see if LULU holds up through earnings, which are scheduled for release on March 17. If I owned LULU going into earnings, I would probably protect myself by purchasing a put option, in case its earnings disappoint. A stop loss order would not help me if the stock gapped far down.
A March 75 LULU put option (that expires on 3/18) would give me the right to “put” 100 shares of LULU to someone at $75 per share, and would cost about $2.80 per share, or $280 for 100 shares (all options are for 100 shares). This means that if LULU collapsed after earnings release, I could sell my shares the next day at $75. While I would receive $75 for each of my shares, my take away would be $75 – 2.80 for the option, or $72.20 per share. So, if I bought LULU at the open on Monday for about $77 per share, and the stock falls after earnings, the largest loss I would incur is $4.80 per share ($77-72.20), excluding transaction costs. In order to make up for the cost of this insurance, my break even price on LULU is $79.80 ($77 +$2.80 cost of option). In this example, I was buying a put option that expires on 3/18. If I wanted protection for a longer period I could pay more for an option expiring in future months. Buying put options for insurance can be a very conservative strategy for protecting your money if you are buying high momentum stocks that might advance more than the cost of the stock+option. Last September, when I went long stocks at a time that the market had been weak and I was therefore anxious, I protected myself with put options and did quite well. If you are interested in this technique, check out my longer post on buying put options for insurance.
Dr Wish, I was at the Worden seminar Saturday but didn’t get a chance to meet you (had to leave early due to a bad back). I’m finding that I don’t have time to day trade, but I do follow your suggestions quite a bit and I like your philosophy. Do you offer professional financial services?
Sorry, I do not. My goal is to teach people how to manage market risk themselves, based on my 40 years of experience. Find an adviser with a proven track record who is not afraid to exit the market.