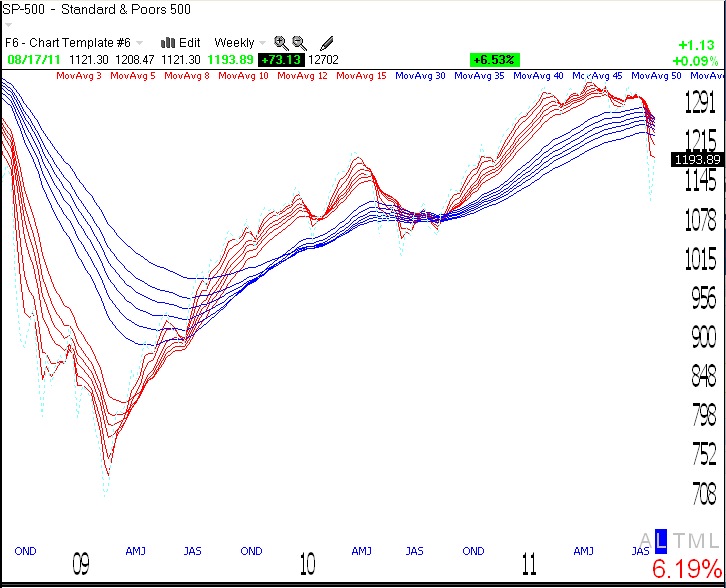
IBD announced in Thursday’s edition that the latest sentiment poll had almost twice as many bulls than bears. This amount of bullish advisers is not what you would expect if the market were near the bottom of a decline. This weekly GMMA chart of the S&P 500 stock index shows that the shorter term averages (red) are just breaking below the longer term averages (blue). It is still too early to determine if this down-trend will develop into a stage 4 major decline. Click on chart to enlarge.
With the futures down a lot this morning, we need to see whether this renewed decline will hold above the recent lows. I am in cash and safely watching from the sidelines.