I transferred all of my university pension from mutual funds to a money market fund. I know I should have done this in stages, but I just got tired of worrying about the risks. I am willing to give up subsequent gains for a while in return for the comfortable thought that I probably will not lose any more of the money I will have for retirement. I did not act solely because of my emotional fatigue, however. I am mainly acting on my established rules that say that when the GMI is very weak and the major indexes are below their 30 week averages, I am supposed to be in cash. So I took advantage of Friday’s strength to sell out at the closing prices at the end of the day, which is how mutual funds are priced for sale each day.
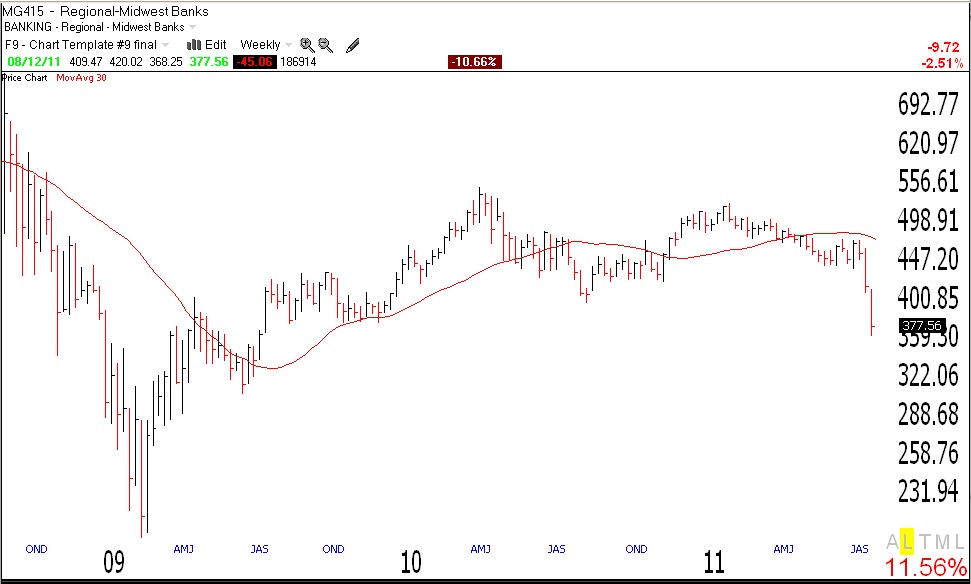
In addition to having all of my technical indicators negative, I do not like the way so many sectors look. The banks are declining fast again, just like they did in 2008. In addition, many industry indexes have broken below the levels they found support at in the 2010 consolidation. An example is this weekly chart of the Morningstar Midwest Banks index. Note the break below the bottom reached in August, 2010. (Click on chart to enlarge.) The same pattern can be seen in the following banking sectors, to name just a few examples: Southeast banks, Pacific banks, Money Center Banks, Northeast Banks. Similar chart patterns can be found in investment brokerage, trucks, construction, health care, steel and iron, appliances and regional airlines. What is this market telling us? The last time I saw similar consistent breakdowns in banking stocks was in 2008 near the beginning of the financial crisis.
As of Friday, the percentage of stocks closing below their critical 30 week long term averages are: Dow 30, 83%; S&P500, 87% and Nasdaq 100, 81%. I do not own any stock that is below its 30 week average.
Could I have sold out near the bottom of the decline? Of course, but I have to follow my rules. I exited to cash at the proper time a few weeks ago in my IRA and margin accounts, both of which retain nice gains for this year. I did not do so in my university pension accounts at the time because of the penalties for market timing, and I did therefore lose some money. I am now content to wait for the all-clear signal from my indicators and to then go back into the market slowly.
Most bottoms do not end with a sudden burst up. There usually is a multi-week period of backing and filling as a base is formed. I therefore would not be surprised to see the market give back some of its recent gains in coming weeks. What I am trying to do is to avoid being swept up in a new leg down. If one cannot exit the market to go to cash, one should not be in the market at all. Too many people are addicted to the rush of trading. But all of my trading gurus have written that there is a time to be out of the market.
The main indicator that makes me question my decision to sell is the Worden T2108 indicator, which went into single digits last week and is now at 13%. Single digits i T2108 are rare and tend to occur near market ottoms. But the T2108 could rise with a market rebound, and then decline again. I was tempted to go long the indexes last week in my trading accounts, but resisted the temptation. So, the T2108 may yet prove me wrong……
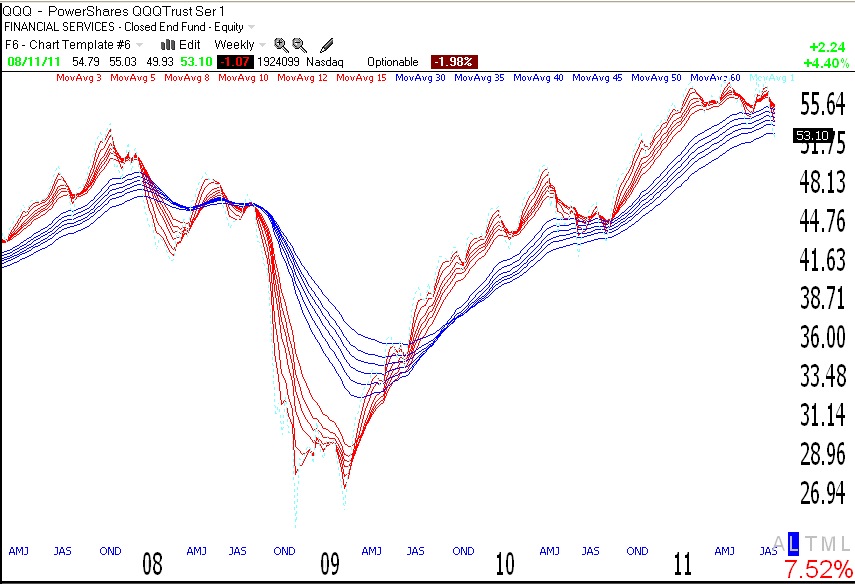
The GMI and GMI-2 each remain at zero. 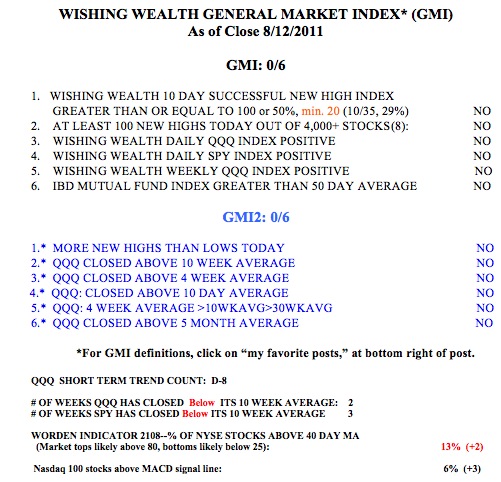 Friday was the 8th day of the new QQQ short term down-trend. The QQQ has closed below its 10 week average for 2 weeks, the SPY, for 3 weeks. In 2008, the SPY broke down before the QQQ, because the QQQ does not include financial stocks,which were leading the market down. Only 6% of the Nasdaq 100 stocks have now closed with their MACD above its signal line, reflecting the short term weakness in most tech stocks.
Speaking of tech stocks, AAPL has held up beautifully during this decline. That is a very good sign. However, if this decline turns into a bear, look for it to end only after it gets around to AAPL. The bear will eventually devour everything, even the market’s darlings.