All GMI indicators negative, T2108 at 13%; not enough bears?

GMI0/6
GMI-20/9
T210813%

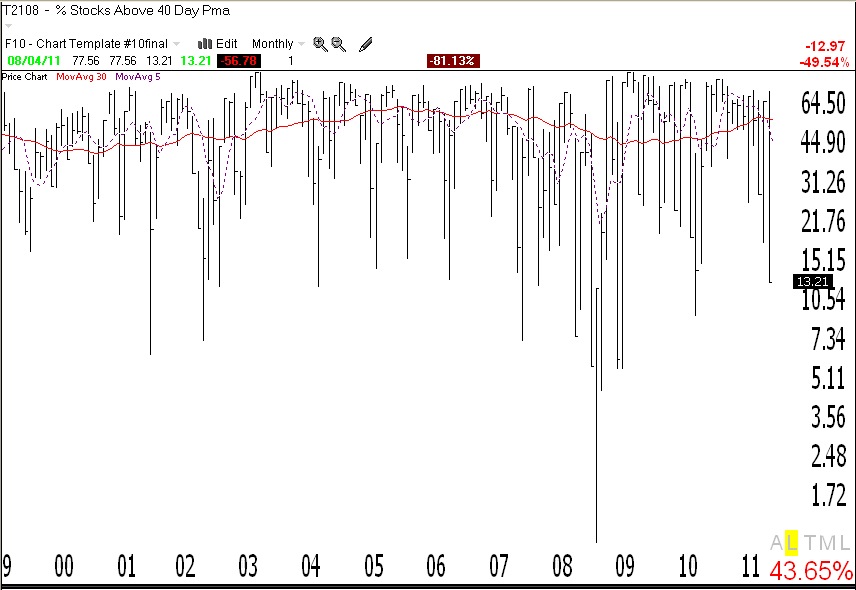
With the GMI and GMI2 at zero, the T2108 is at 13%.   In prior extreme declines T2108 has bottomed at <1% (1987)   and around 1%. (08)   But as this monthly chart shows, declines more often bottom anywhere below 20%.   My biggest concern is that investor sentiment polls are not very bearish and pundits are still looking to buy bargains. I remain in cash in my trading accounts.

I would be very interested in hearing whether my posts have helped you weather this decline.

GMI is down to 1, GMI2=0; mainly in cash

GMI1/6
GMI-20/9
T210824%

The QQQ short term up-trend will end if the index closes below 57.54 again on Wednesday. The T2108 is at 24%, not yet in extreme oversold territory where most large declines end.   I am largely in cash in my trading accounts with a small short position. My university pension money is still in the growth mutual fund, primarily because I do not want to be penalized for market timing.   If I could easily get out, I would reduce my positions.