A lot of leaders are breaking down. This is a good time to be on the sidelines in cash in my trading accounts.
Month: April 2012
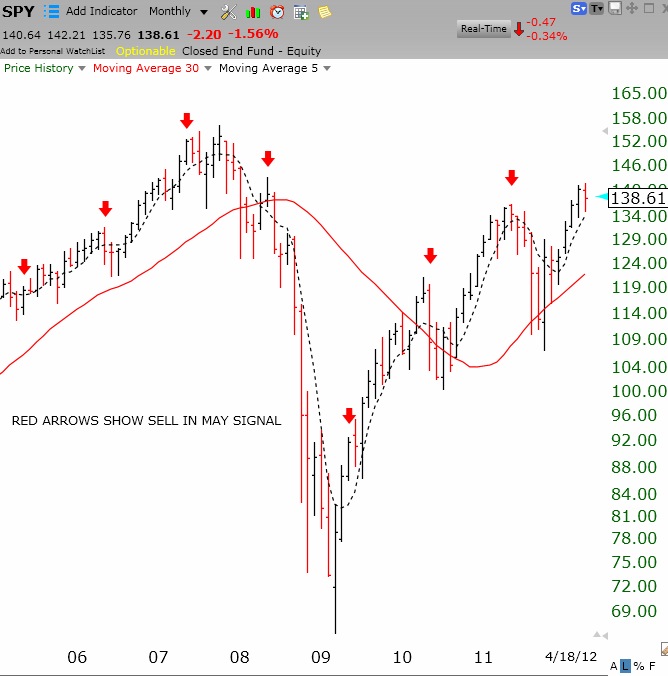
GMI = 2; 3rd day of QQQ short term down-tend; Sell in May and Go Away?
I will be more confident of this new QQQ short term down-trend if it can last two more days. I remain in cash and short gold in my trading accounts and invested long in mutual funds in my university pension. After earnings are out, we approach the dreaded, “Sell in May and Go Away,” period. This monthly chart of the SPY suggests to me that since 2005, in periods when the market had been rising for months leading up to May (like the present), with the exception of the strong rebound from the decline of 2008, the market has stumbled in the period after May. What do you see? Click on chart to enlarge.
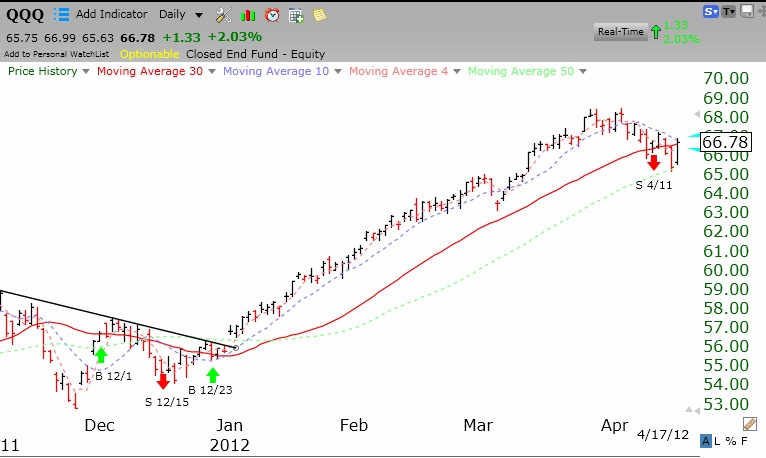
GMI rebounds to 3; QQQ short term trend still down, longer term trend remains up
With Tuesday’s rebound the GMI rose 2, to 3 (of 6). IBD still considers the market to be in a correction, absent a large volume increase (follow-through day) in one of the averages. Tuesday was the second day of the new QQQ short term down-trend. I have observed that if a new short term trend can persist for five days, there is a high probability that it will continue for at least several weeks. If the QQQ should rise on Wednesday, the short term trend will turn up again. Trend followers resist predicting the trend, we call the trend after it has defined itself. The GMI sell signal issued on 4/11 is still in effect, as this daily chart of the QQQ shows. Click on chart to enlarge.
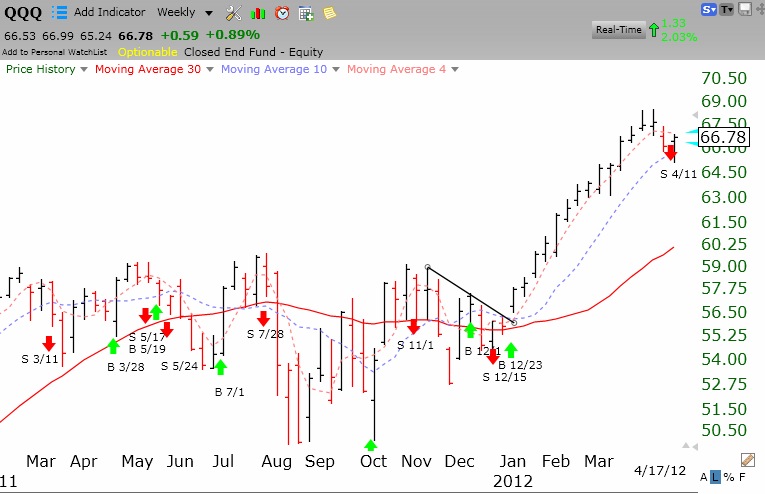
The QQQ remains in a strong Stage 2 up-trend. My longer term university money remains invested in mutual funds. Stage analysis uses the weekly chart:
 If you cannot see the charts, please go to the original site URL.