28th day of QQQ short term up-trend but GMI-2 down to 4 (of 8); ONVO tanks with 3D stocks; Getting defensive

GMI6/6
GMI-24/9
T210853%

While the GMI remains at 6 (of 6) my most sensitive short term indicators have weakened, with the GMI-2 now down to 4 (of 8). We are likely in the post earnings release period when stocks weaken until we get close to the next quarter’s earnings release,   in January. With the GMI at 6, the longer term up-trend remains intact.

Meanwhile ONVO and the other two 3D stocks I follow swooned on Tuesday.   ONVO fell almost 25% on its highest trading volume ever, an ominous sign of weakness. It also failed its green line break-out. Below are the daily charts for ONVO, DDD and SSYS. When a hot sector like 3D fails badly, it often foreshadows a decline in the greater market.   I have become defensive and have greatly reduced my holdings in my trading accounts.

ONVO11192013DDD11192013SSYS11192013


27th day of QQQ short term up-trend; Bollinger Band constrains QQQ and gives me an edge

GMI6/6
GMI-27/9
T210857%

QQQ fails to break above top Bollinger Band (15,2) and bounces down.

QQQdaily11182013I look for support at the lower band, around 81.77. I find that the 15 day 2 standard deviation   Bollinger Bands are very useful for identifying short term support and resistance levels for the index ETF’s. Just look at the daily chart below to see how prices stay within the bands. A move outside the bottom band is often a sign that the index will reverse up. However, if the lower band is broken and starts to turn down, it often tells me that a larger decline is imminent. While not perfect, the BB’s give me an edge when interpreted   in the context of other confirming indicators. You can plot Bollinger Bands yourself on most stock charting programs.   Freestockcharts.com is a simpler, free version of TC2000 (the subscription software I use).

QQQBBchart

All indicators remain positive; GMI based strategies lead to large gains in 2012 and 2013; ONVO soars

GMI6/6
GMI-28/9
T210859%

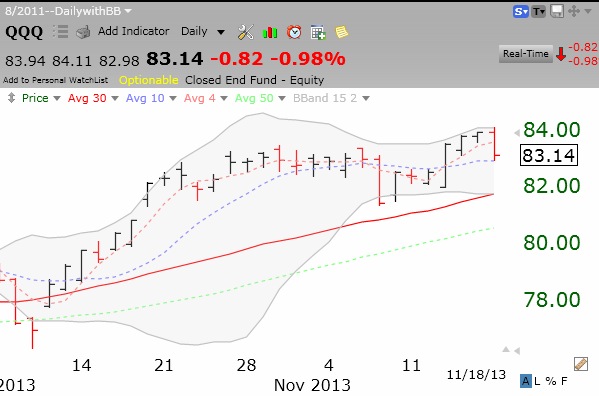
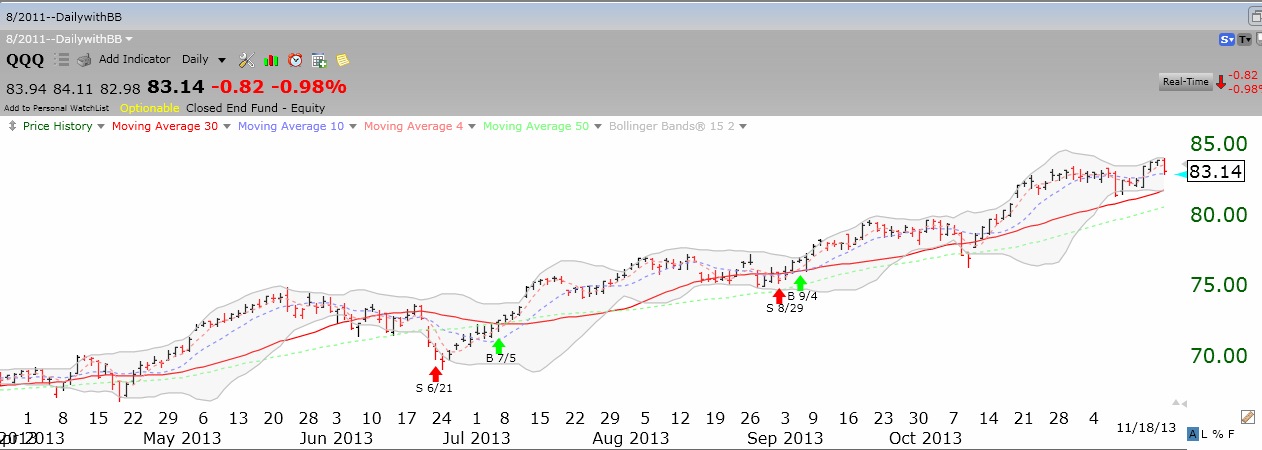
The Dark Liquidity site has been comparing the GMI   based trading strategy versus a number of other strategies.   For each of the last two years a strategy that bought the QLD whenever the GMI signaled buy, and went to cash every time it signaled sell beat all other strategies followed.   In 2012 the GMI based QLD strategy was up about +30%   and thus far in 2013 it is up +42%.   I do not check that site’s computations, but my experience is that repeatedly, buying QLD when the GMI signals buy has usually worked.   Since the last GMI buy signal on September 4, the QQQ is up 9.3%, the SPY is up +8.5% and the QLD is up 19.5%.   For those willing to trade TQQQ, the speculative 3X leveraged QQQ bullish ETF, it is up +29.9% in the same period.   While past performance does not guarantee future results, it is striking to me that I have found and posted   similar results for prior up-trends signaled by the GMI.

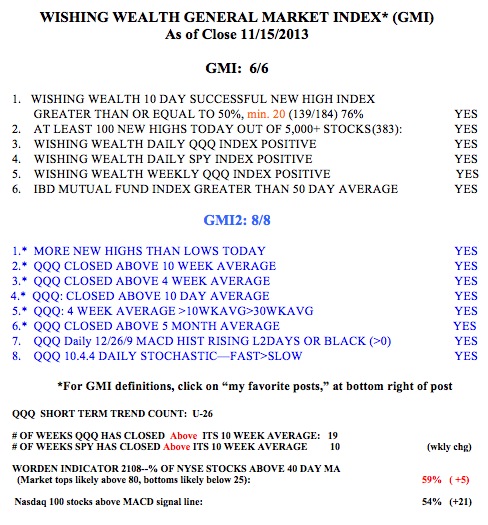
With that as an introduction, here is the current GMI and its components. After a down-trend, two days with the GMI above 3 signals a buy and two days below 3 signals a sell. I continue to post the GMI signals to the right of this site. I would be interested in hearing from my readers whether they have been able to trade successfully based on the GMI.

GMI11152013

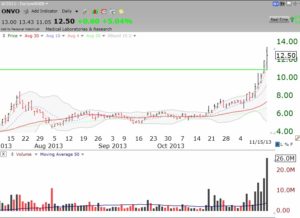
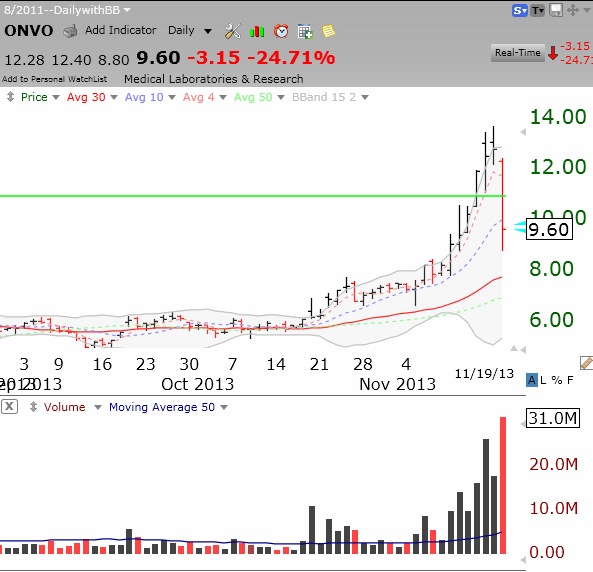
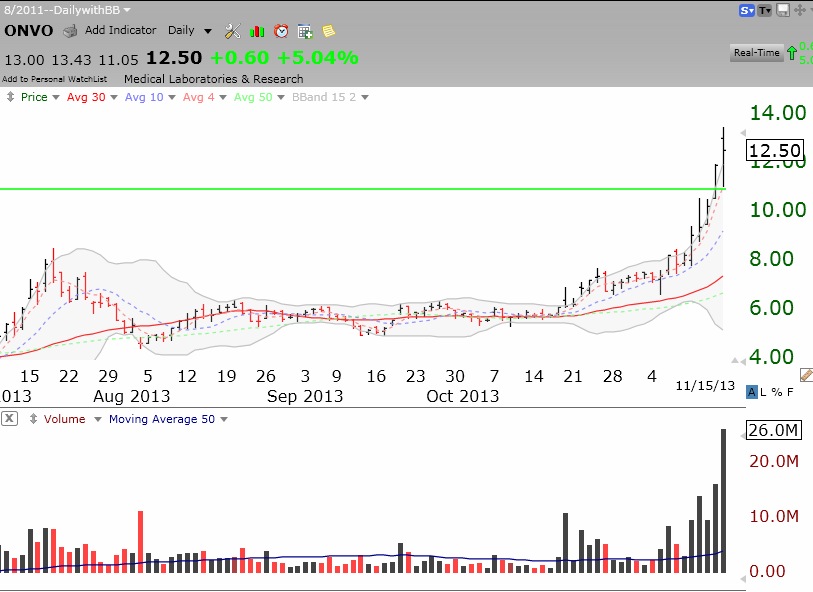
For those following ONVO, it had its highest trading volume ever, 26 million shares, on Friday. With the stock going near vertical, it is very dangerous.   But it did burst through its green line top! When I first posted about it when it was around $4, I warned that it was like buying a lottery ticket.   It still is…..

ONVO11152013