25th day of QQQ short term up-trend; ONVO has green line break-out

GMI6/6
GMI-28/9
T210855%

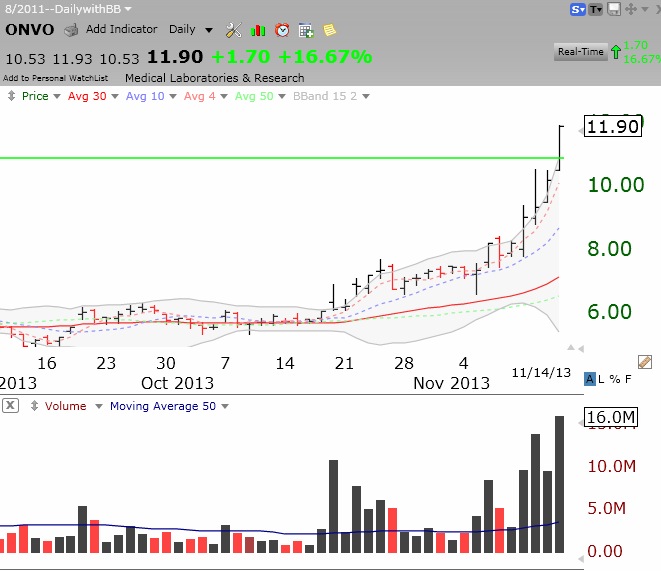
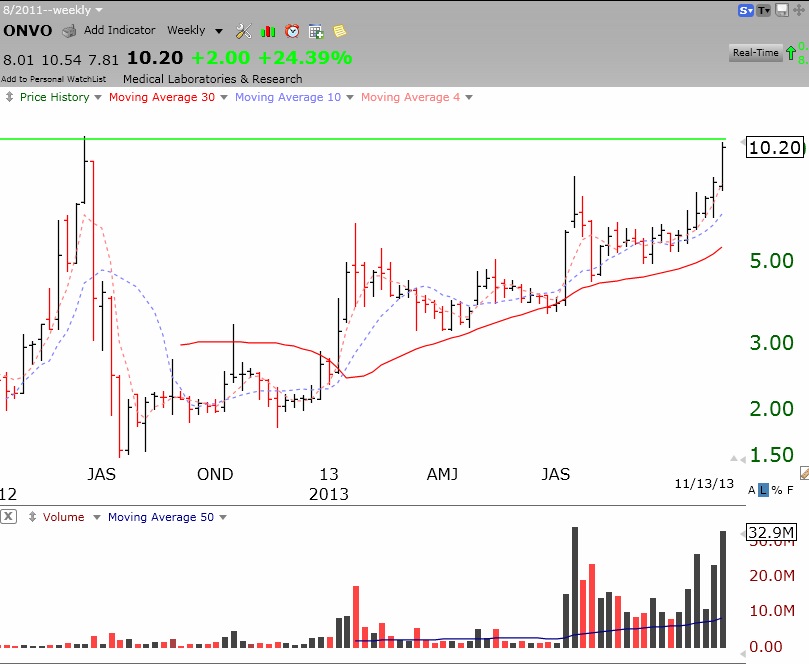
ONVO   is   an almost vertical climb.   It broke above its green line top on Thursday and has closed at an all-time   high. Normally this break above a multi-month top would be a major buy signal, but this strong rise could be a climax run or reflect some important development in their business? I still have a small position in ONVO, but it remains a very speculative and fragile holding for me.

ONVO11142013


GMI back to 6 (of 6); ONVO strong again; YHOO breaking out

GMI6/6
GMI-27/9
T210852%

It looks to me like ONVO could break its green line top and go on to an all-time high soon. That would be a major buy signal for me. I already own ONVO.   Check out its weekly chart.

ONVOweekly11132013I also think YHOO is breaking out again.   I own YHOO. Check out this daily chart. YHOO is breaking out of its Bollinger Band consolidation.

YHOOdaily11132013

This weekly chart shows YHOO to be in a nice Stage 2 up-trend.

YHOOweekly11132013

23rd day of QQQ short term up-trend; Gold in a BWR down-trend

GMI5/6
GMI-24/9
T210850%

Here is   a weekly GMMA chart of the gold ETF, GLD.   Gold is in a BWR down-trend with all of the shorter term averages (red) declining below the longer term averages (blue).   This is the opposite of the RWB rocket stock pattern I have discussed before. Note GLD’s RWB pattern during the up-trend through mid-2011. (The green lines are prior multi-month bases at all-time highs.)

GLDweeklyGMMA