1st day of new $QQQ short term up-trend; GMI back to Buy

GMI6/6
GMI-27/9
T210850%

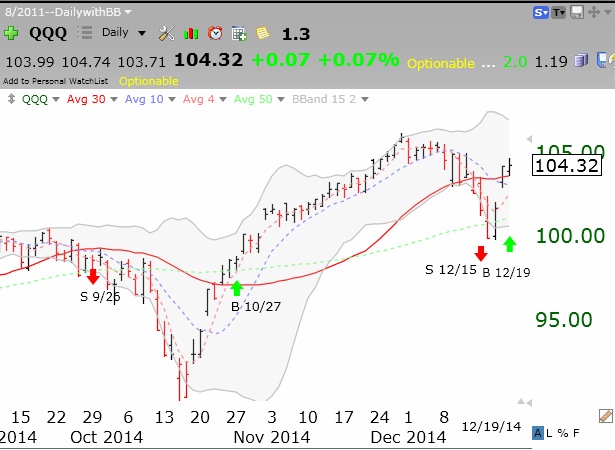
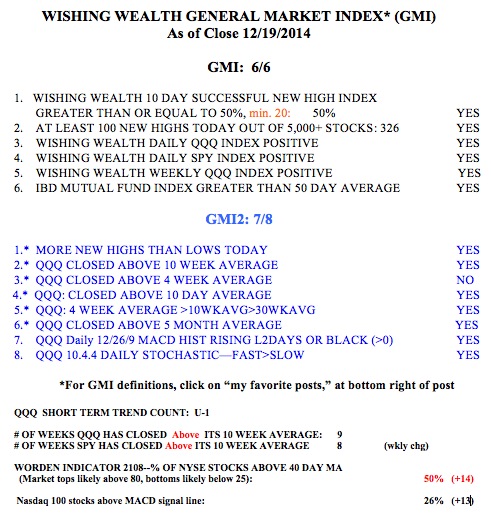
The QQQ short term down-trend only lasted 4 days. I have written that short term down-trends often last under 5 days and that I do not trust a short term trend change until it persists for at least 5 days. The GMI Sell signal also only lasted for 4 days. As of Friday’s close the GMI signaled a new Buy.   IBD still sees the market in a correction.

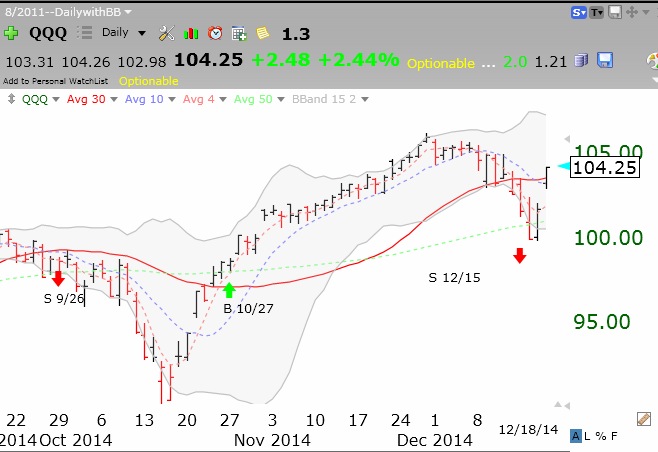
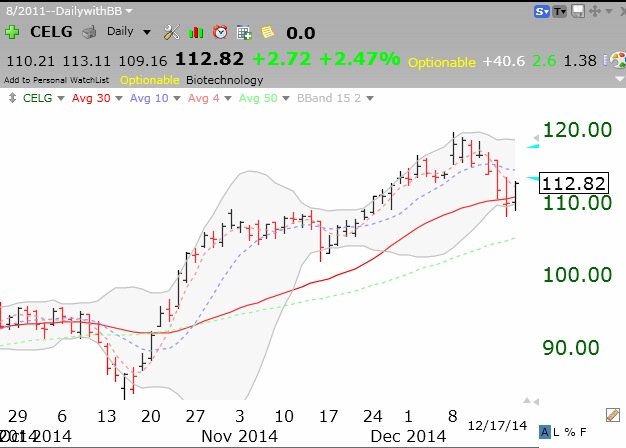
I expected December to end strong because of mutual fund window dressing. But when the GMI issued its Sell signal, I shed most of my long positions.   The bounce we have had looks a lot, technically,   like the bounce we had in mid-October.   The QQQ bounced from its lower 15.2 daily BB. So maybe it will persist.   If I fly by instrument I would go long here. But my instinct is to hold back for a while. I just do not trust this bounce.   Are the problems that precipitated the recent decline really over?   So, for now, I am mainly in cash. (I may prove to be the ideal contrary indicator!)

QQQdaily12192014GMI12192014

My market indexes on brink of turning positive; buying climax?

GMI5/6
GMI-27/9
T210847%

With the GMI back to 5 and the short term trend about to turn positive, it looks like we may have had another small and short lived correction. IBD still sees the market in a correction and is waiting for a follow-through day to this current snap back rally. I still think this rise could be a brief bout of year end mutual fund buying (window dressing) that could quickly disappear with the new year.   So I must be very nimble and ready to exit if the market fails to surpass its recent peak of 2079 on the S&P500 and 106 on the QQQ. Below is the daily chart of each index. This rally   seems a little too frenetic to me–climax run? Given that the market always falls quicker than it went up, the next decline will likely be a doozy. Note the 30 day average (red line) of both indexes is flat, which often leads to a lot of whip-saws. Failure of these averages to hold this line on Friday would be a very bearish sign to me.

SP50012192014

QQQ12192014

3rd day of $QQQ short term down-trend; Dead cat bounce? $CELG bounces

GMI1/6
GMI-22/9
T210837%

It is too early to discern if Wednesday’s bounce from oversold will hold. This is likely a good opportunity for me to reduce my holdings in mutual funds in my university pension accounts. I am not willing to risk a return to the losses my 403 (B) sustained before yesterday’s bounce. Failure of this bounce to hold would be bloody. For now, the short term trend of the QQQ remains down.

On the other hand, a lot of my oversold bounce alerts in TC2000 went off on Wednesday. If the market were in a short term up-trend I would buy some of these bouncing stocks.   An example would be CELG, which bounced from its lower 15.2 daily BB and crossed above its 30 day average. Check out this daily chart. Note the similar bounces that occurred last October and again in November. If I had purchased CELG yesterday, I would have placed my sell stop just below the bounce, around 108.25. This is one of the best scans that I teach my university students to run on TC2000. I also put my students on a list to receive all of my TC2000 alerts as they are triggered. Let’s see if CELG (and others like it) can hold this bounce for a few days.

CELG12172014