2nd day of $QQQ short term down-trend; super cautious

GMI1/6
GMI-21/9
T210827%

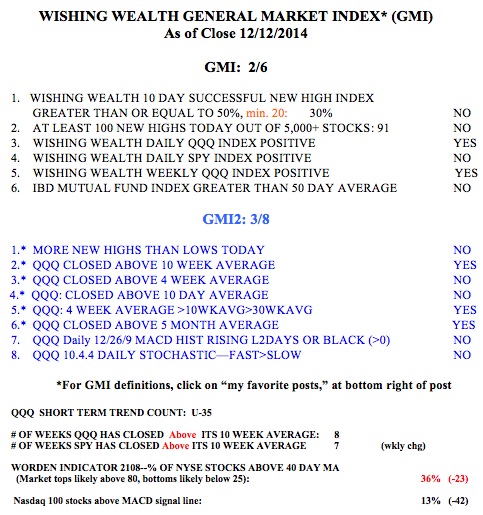
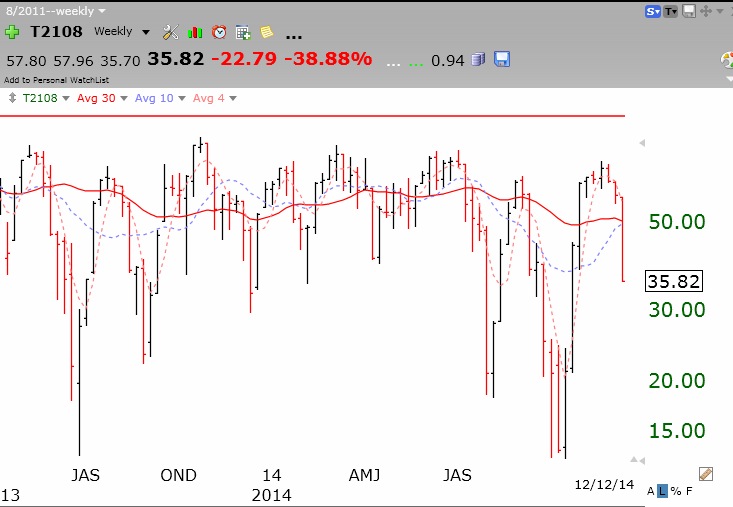
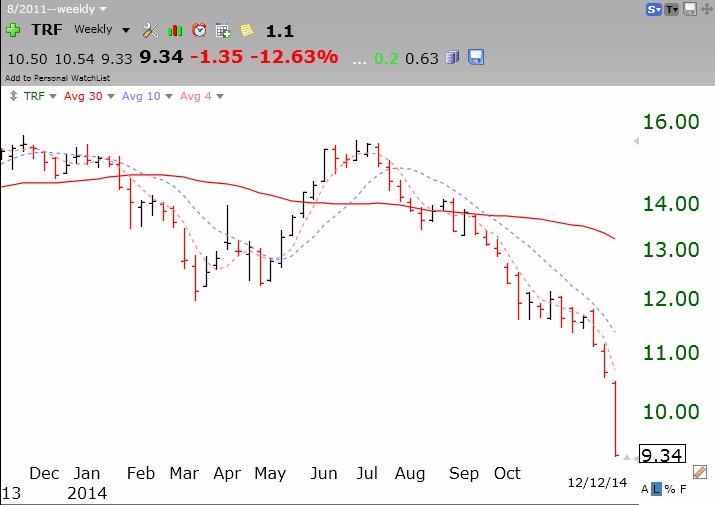
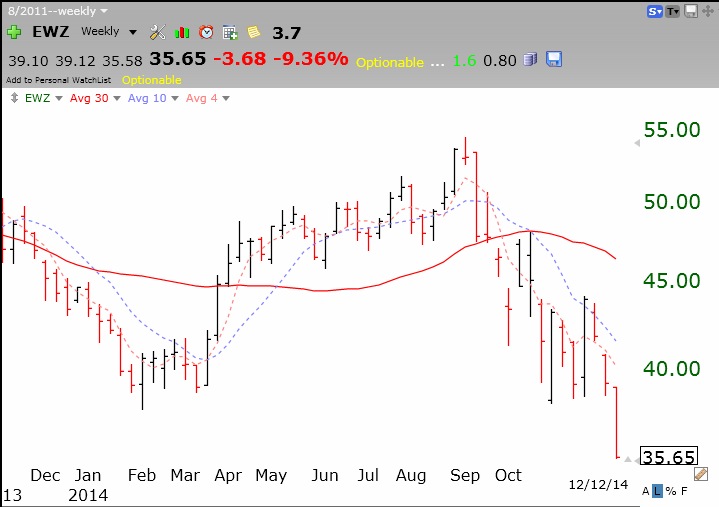
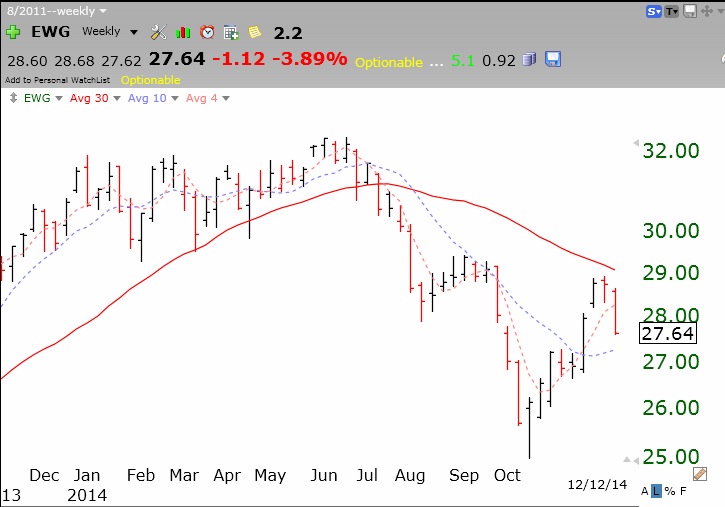
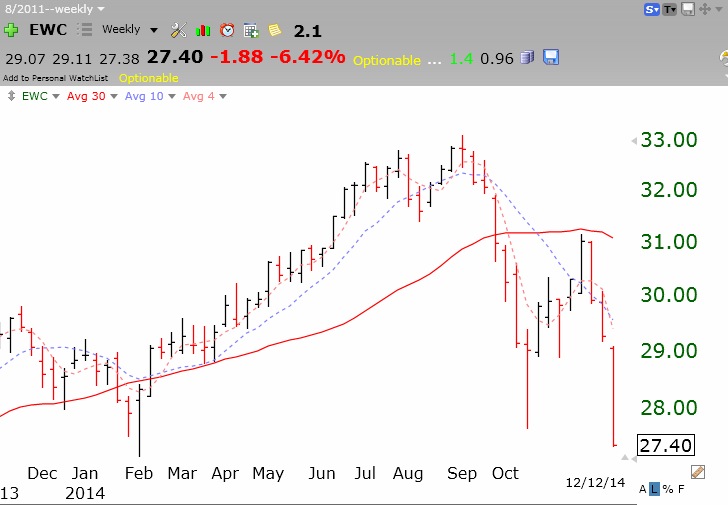
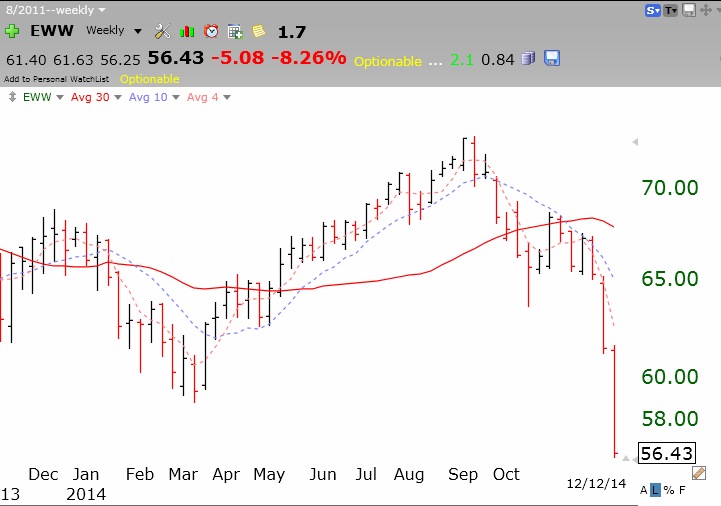
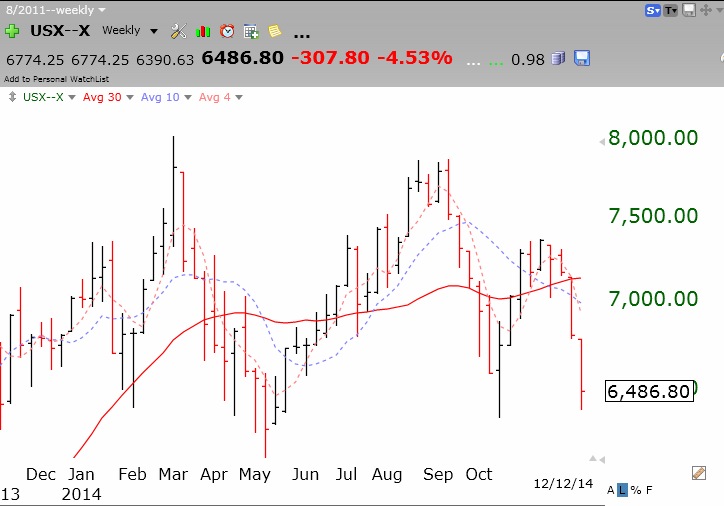
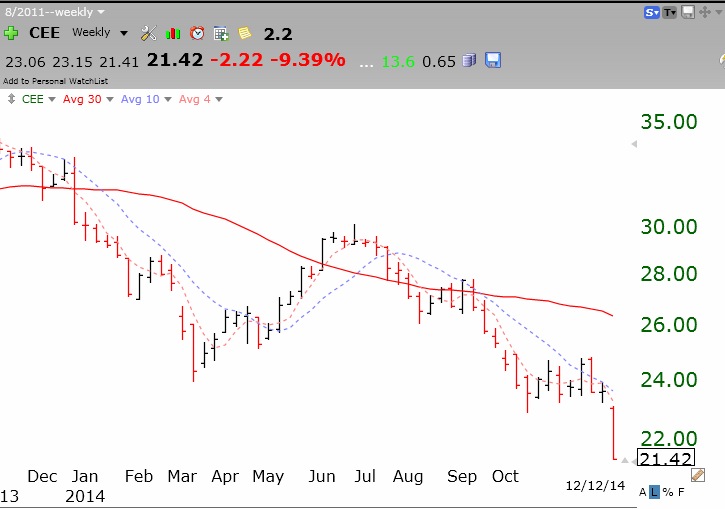
Market is getting very oversold.   T2108 is at 27%, 598 daily new lows, 62% of stocks with an oversold 10.4 stochastic, GMI and GMI-2 both= 1. And yet the longer term trend of the market is still up, in a Weinstein Stage 2 up-trend. Based on my 45+ years of trading experience I think the market has further to decline. So many people have come to     believe that the market only rises, based on the past 5 years of gains.   When the new year starts many may be willing to sell and take their gains in the new tax year. And then there are all of the retiring boomers who will panic from the fear of their imminently needed retirement savings diminishing. I just remember a lot of significant market tops occurring in January…….

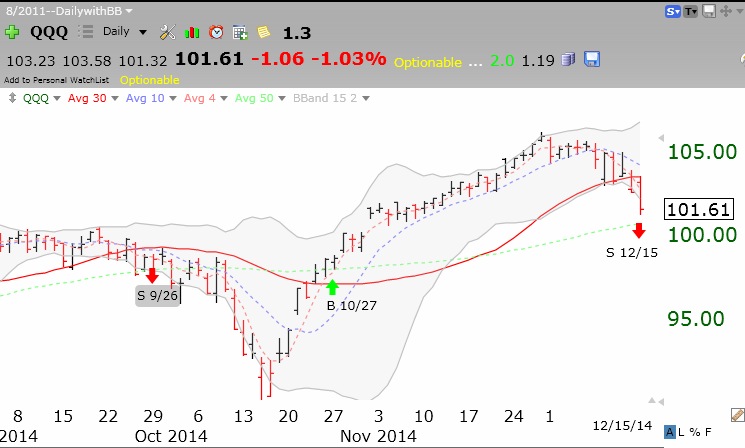
Tuesday was the second day of the new $QQQ short term down-trend. I own mainly SQQQ and will accumulate more if this decline lasts 5 days. Since 2006, about 40% of   short term down-trends (the way I define them)   have lasted     5 days or less. Once one passes 5 days, it often goes a lot further. I remain largely in cash in my trading accounts. If I could frequently trade my mutual funds in my university pension, I would have transferred some money to money market funds.   We need to be super cautious and to read what Mr. Market is telling us about his likely direction.

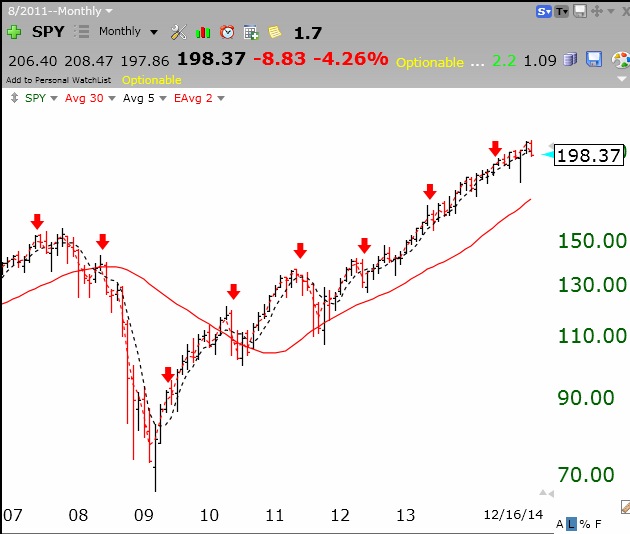
This monthly chart of the SPY shows that the current decline hardly registers. This could mean that the current decline will be tiny or that it is yet to begin…. (red arrows show month of May to track the sell in May signal)

SPYmonthly12162014


GMI signals Sell; New $QQQ short term down-trend; IBD calls correction

GMI1/6
GMI-22/9
T210830%

With the GMI at 1 on Monday, this marks two days below 3 and a new Sell signal.   The QQQ short term trend also turned down.   IBD signaled on Tuesday that the market is now in a correction. I am almost sold out of all of my long positions and hold some SQQQ. Time to watch from the sidelines. This daily chart of the QQQ shows the recent GMI buy and sell signals. Click on chart to enlarge.

QQQdaily12152014

Trend change imminent; World markets in free-fall

GMI2/6
GMI-23/9
T210836%

The GMI registered 2 after Friday’s close and will likely be 2 or less again on Monday, triggering a GMI Sell signal. If so, I will close out my few longs and accumulate a leveraged inverse ETF (SQQQ). The T2108 is at 36% and has a long way to fall before our markets are at the level where declines typically end. (See weekly chart below.)

GMI12122014T2108wkly12142014

I am very concerned that many of the world’s markets are in free fall and we tend to pretend that the U.S. market is immune from the fall-out. Do we really think that the U.S. economy exists in its own cocoon? Take a look at the recent weekly charts of some of the foreign ETF’s:

TRF: Russia/East Europe:

TRFEWZ: Brazil:

EWZEWG: Germany:

EWGEWC: Canada

EWCEWW: Mexico:

EWWUSX–X: China:

USX--XCEE: Central Europe, Russia, Turkey:

CEEAre we worried yet? Or maybe it’s just a benign and temporary oil price precipitated scare….. (would you like to buy a bridge?) I’m not going to wait around to find out. (I have told you I trade like a chicken.)