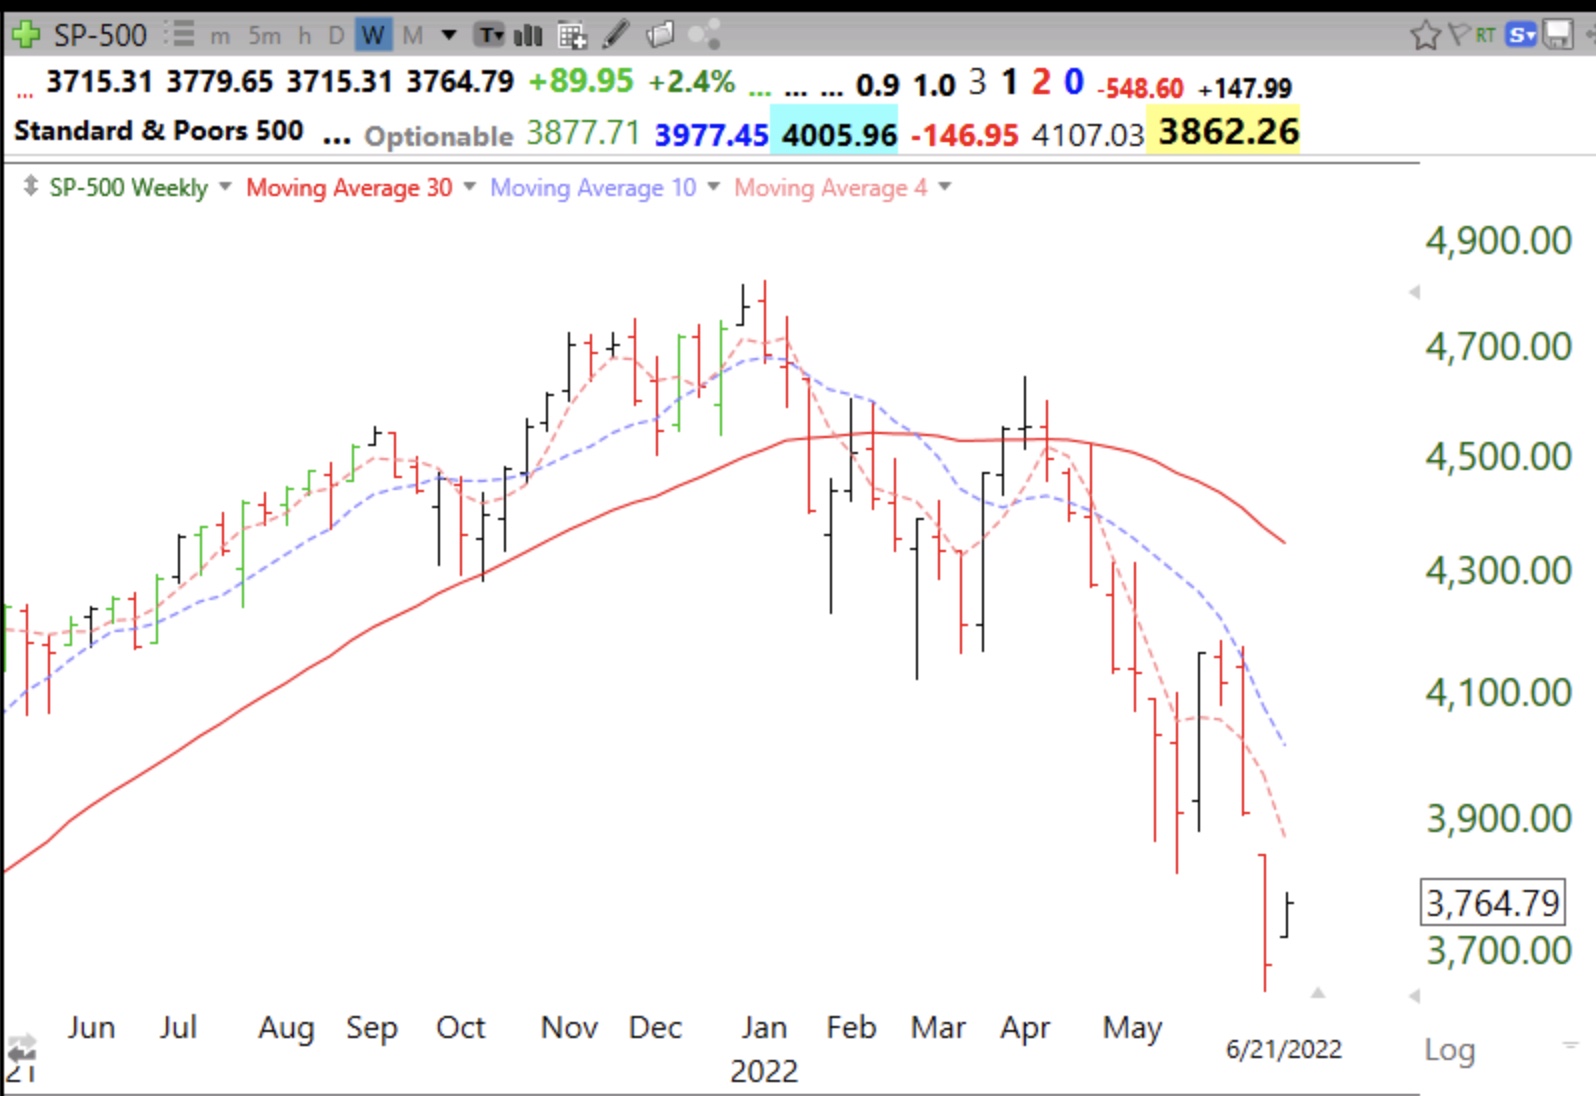
The index could bounce all the way back to the 10 week (purple dotted) or 30 week average (solid red) and still be in a Stage 4 down-trend. The 30 week needs to curve up for me to think the down-trend is ending.
Stock Market Technical Indicators & Analysis
The index could bounce all the way back to the 10 week (purple dotted) or 30 week average (solid red) and still be in a Stage 4 down-trend. The 30 week needs to curve up for me to think the down-trend is ending.