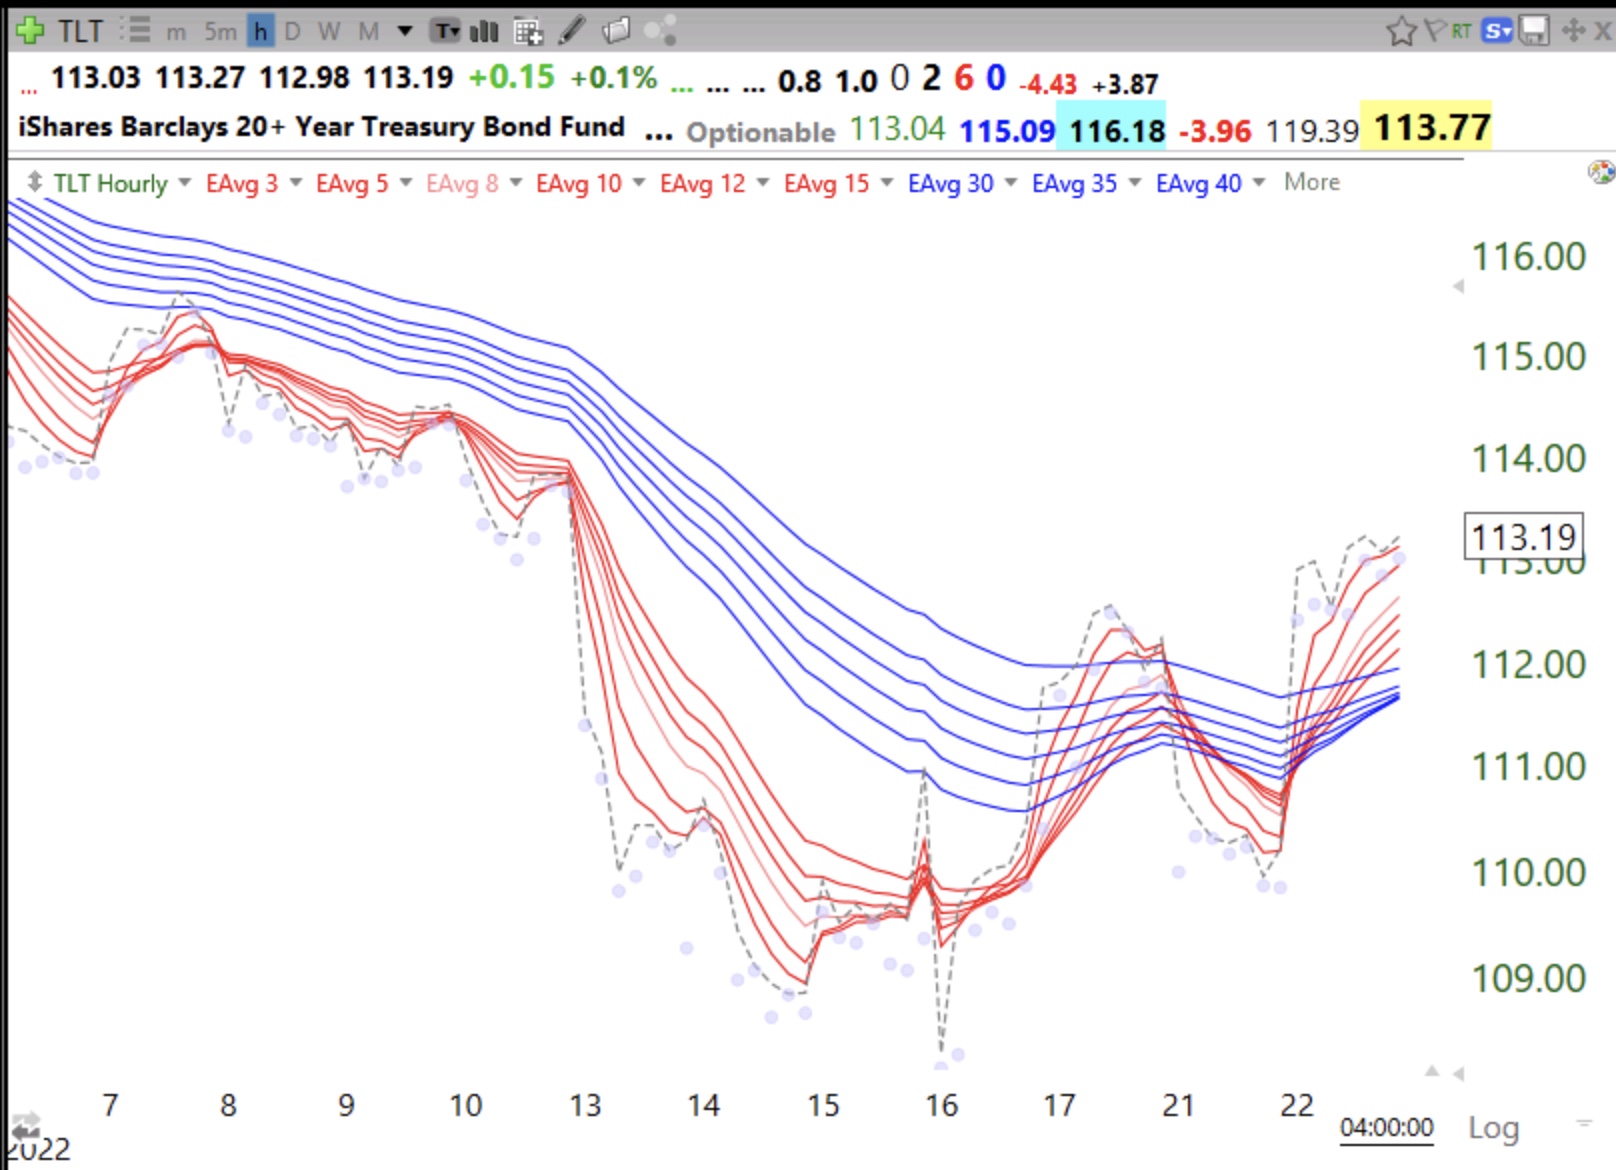
The hourly GMMA chart can pick up changes in trend before the daily chart. This hourly chart shows TLT beginning an RWB up-trend. Why would longer term rates be coming down? Do traders suspect a recession and weaker economy down the line?
Stock Market Technical Indicators & Analysis
The hourly GMMA chart can pick up changes in trend before the daily chart. This hourly chart shows TLT beginning an RWB up-trend. Why would longer term rates be coming down? Do traders suspect a recession and weaker economy down the line?
Or maybe the Fed is not reducing its balance sheet like they said they would
IMHO hourly is insignificant.
Bonds and equities correlate. We are attempting to put in a bottom in the markets.
I wouldn’t bet on that, Andy. Better check again after QuOpEx.