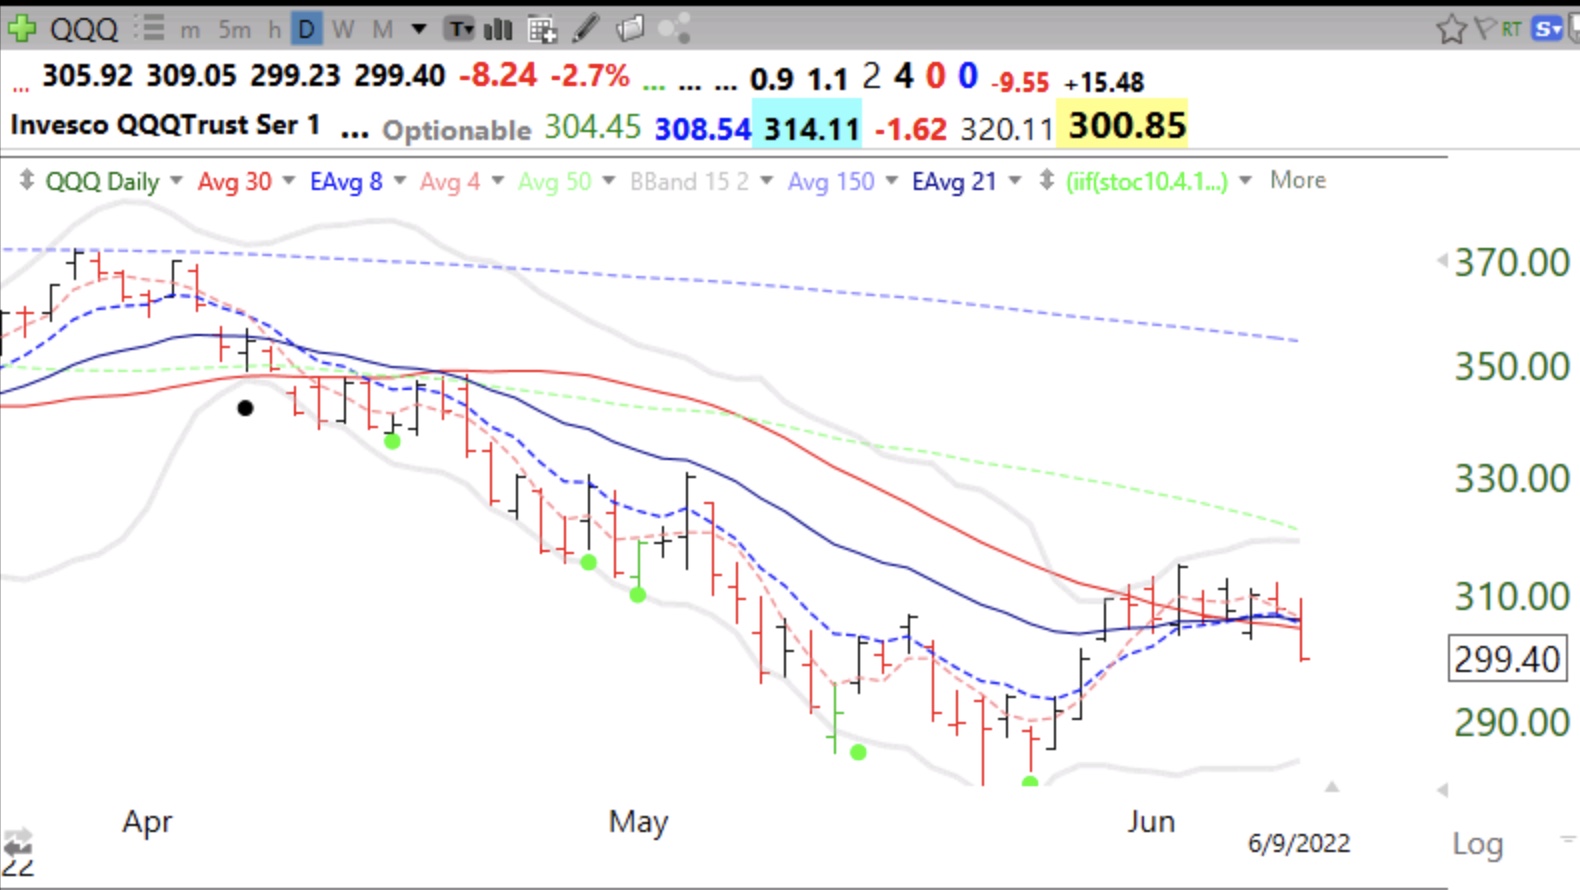
I have rarely seen my indicators whip-saw like this. Only one US stock out of 7,022, PAG, passed my weekly green bar scan. Time to be in cash. QQQ is back below key daily moving averages.
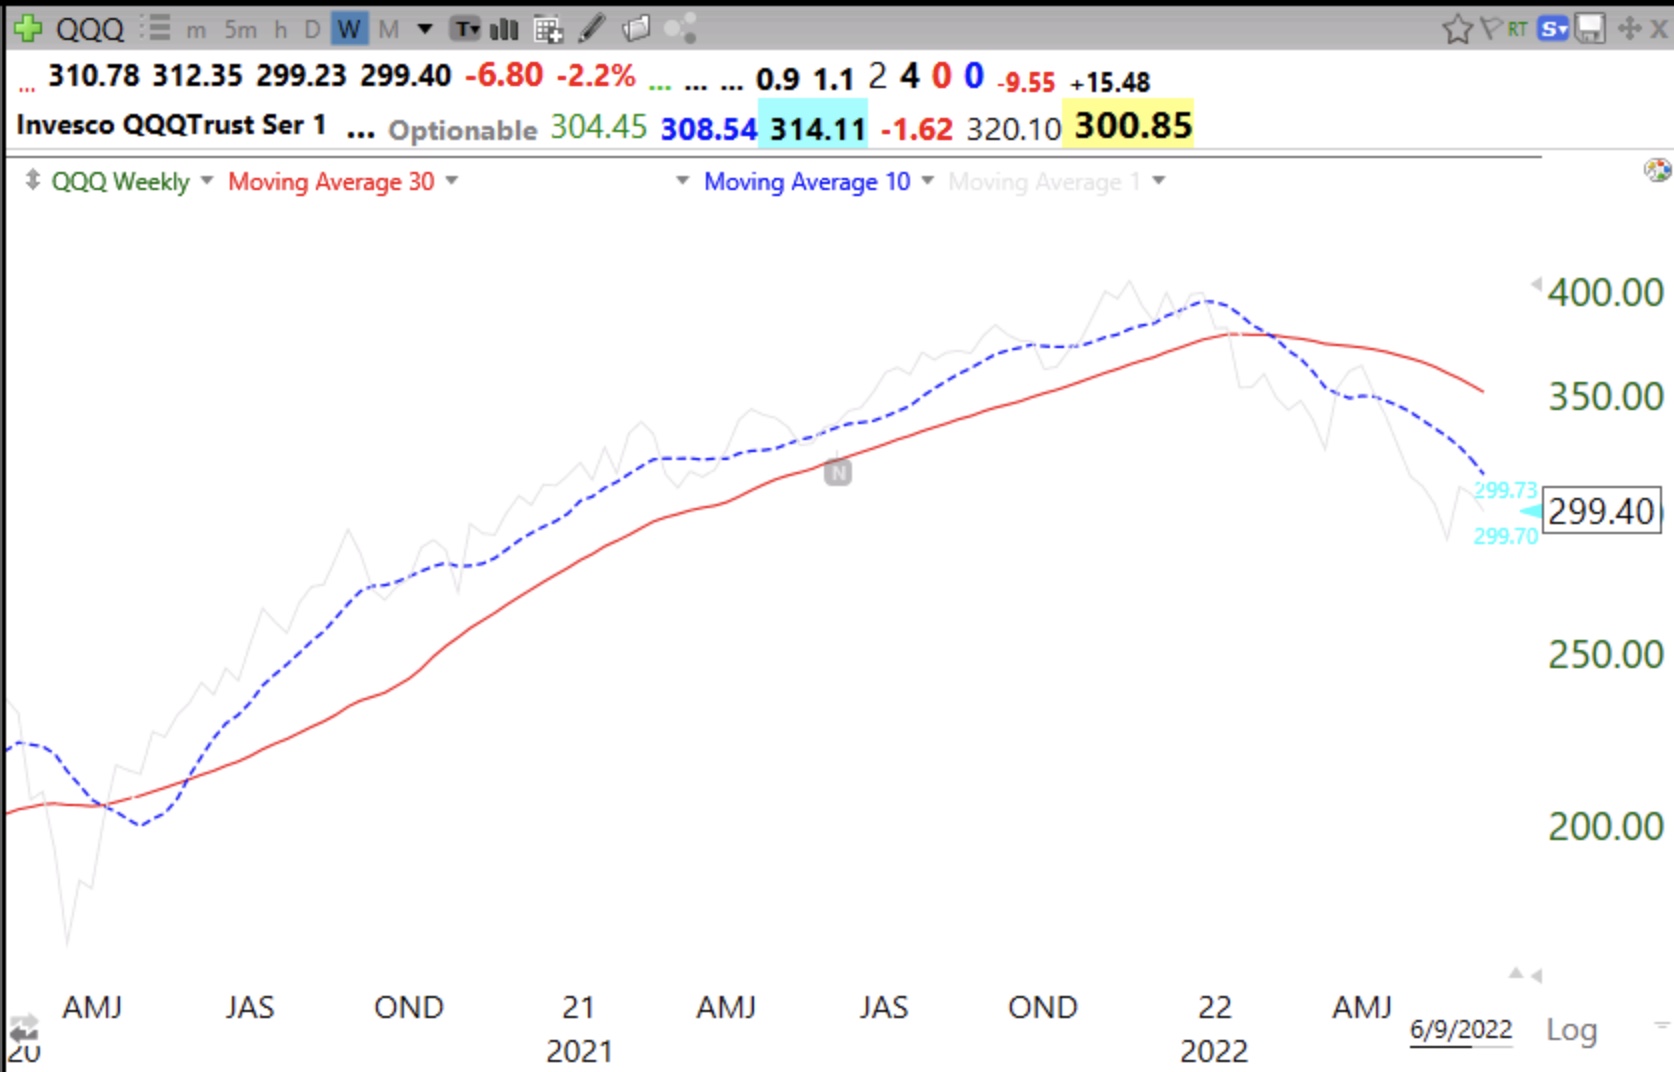
And this weekly chart shows a steady down-trend with the 10 week average (dotted) below a declining 30 week average. We cannot fight the tide. How easy it was to profit buying stocks when the 10 week was climbing above the rising 30 week. It makes sense to me to wait for that pattern to reappear.
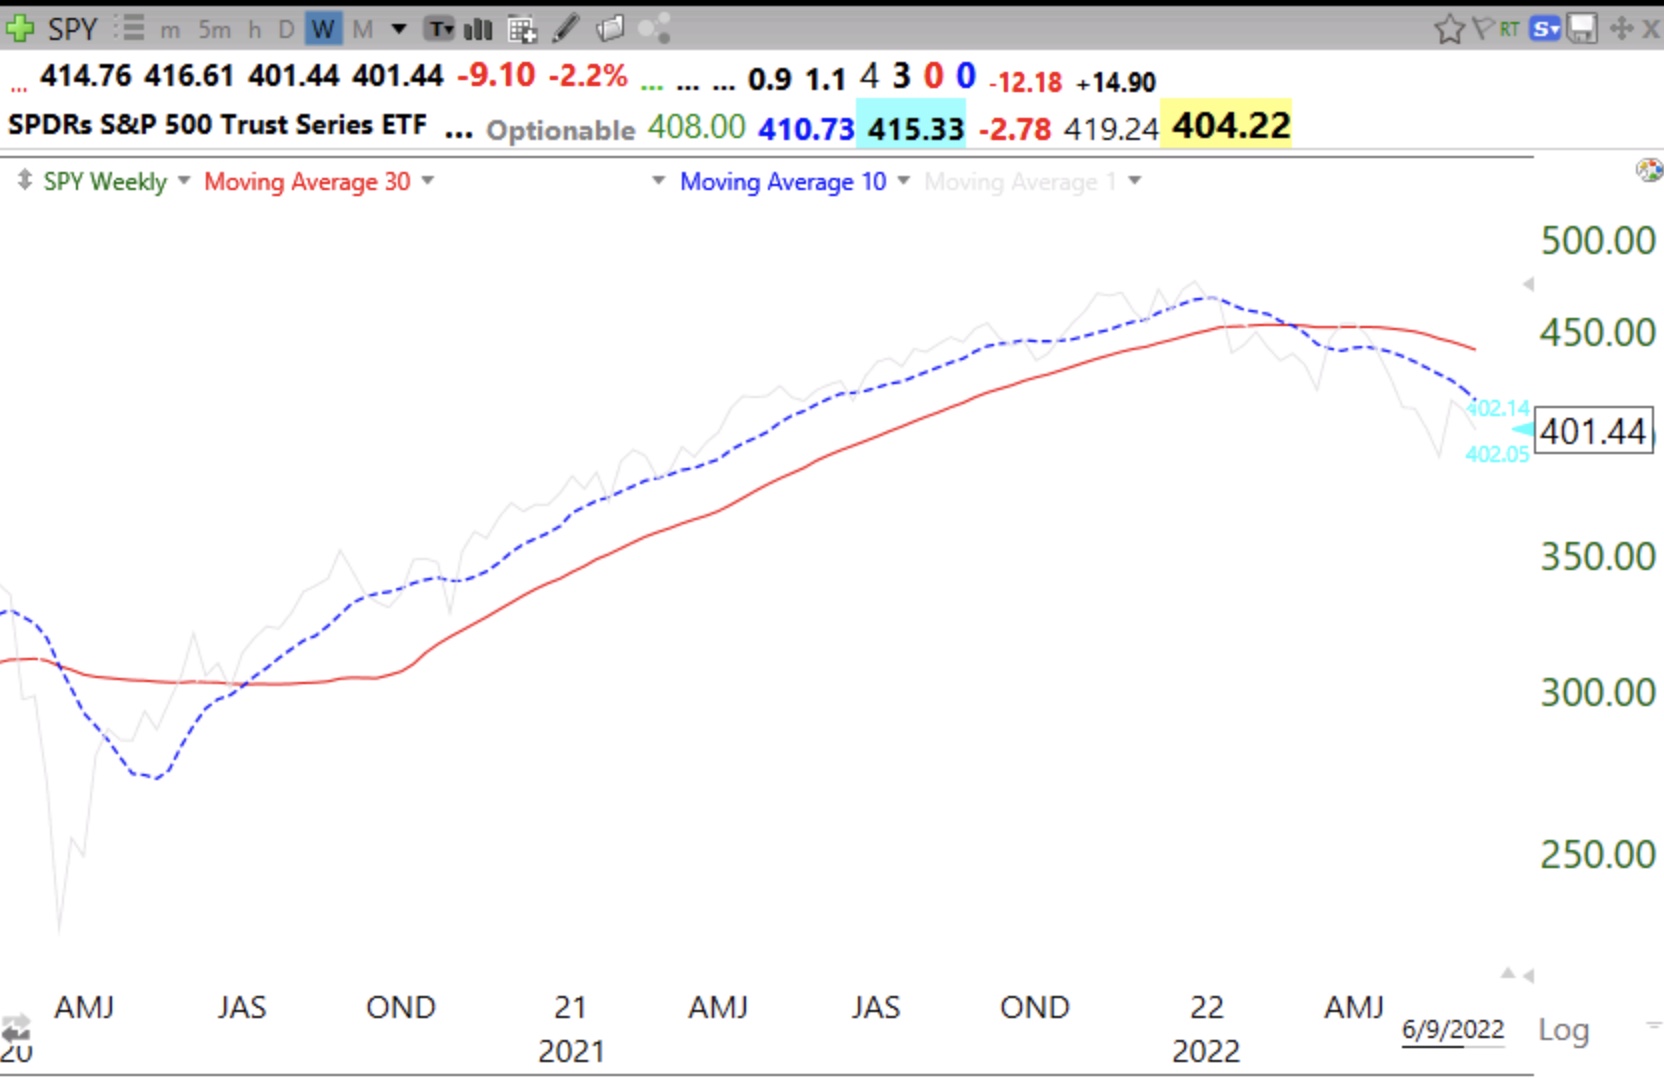
Similar story for SPY.
On the website, the Current GMI Signal continued to show red (never green) since April 12, 2022.