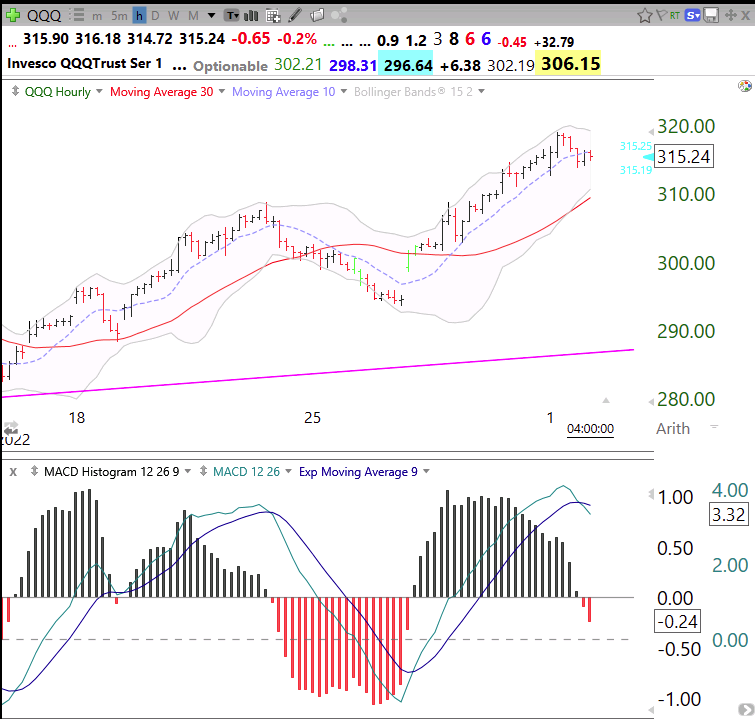
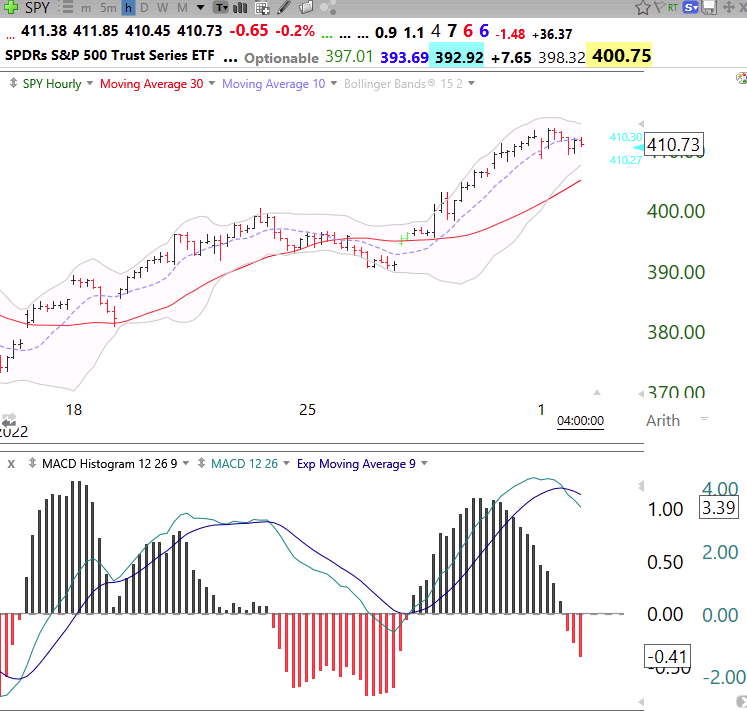
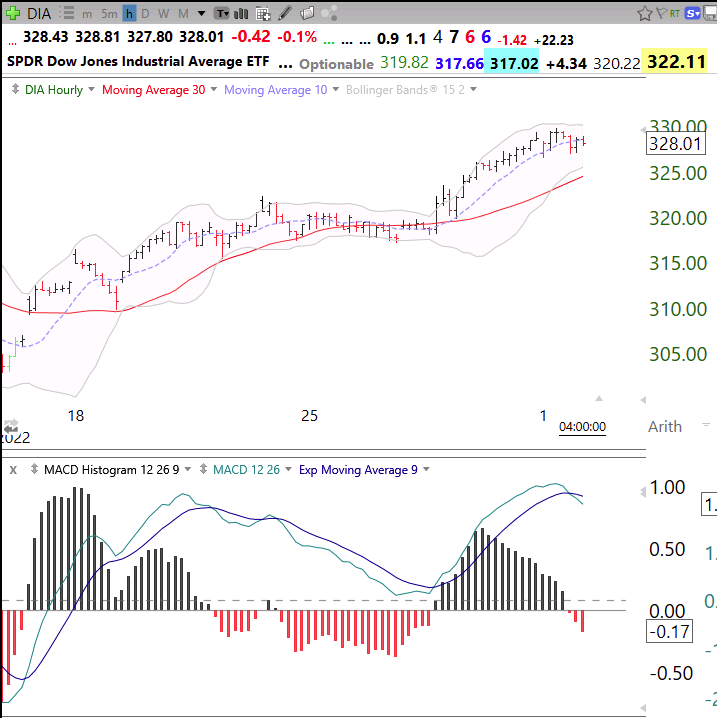
One of the ways I use the 12/26/9 MACD indicator is to focus on the hourly histograms. Study this hourly chart to learn how to use this indicator. When the histograms decline and turn RED, it can signal weakness. The hourly histogram is a very short term indicator and signals small moves. Note the weakening momentum now even as the price has been climbing. Similar negative divergence occurred a week ago. Note also how the rising red histogram bars foreshadowed the recent bounce. Similar patterns of negative divergence are also evident in SPY and DIA where the histograms have also turned red.