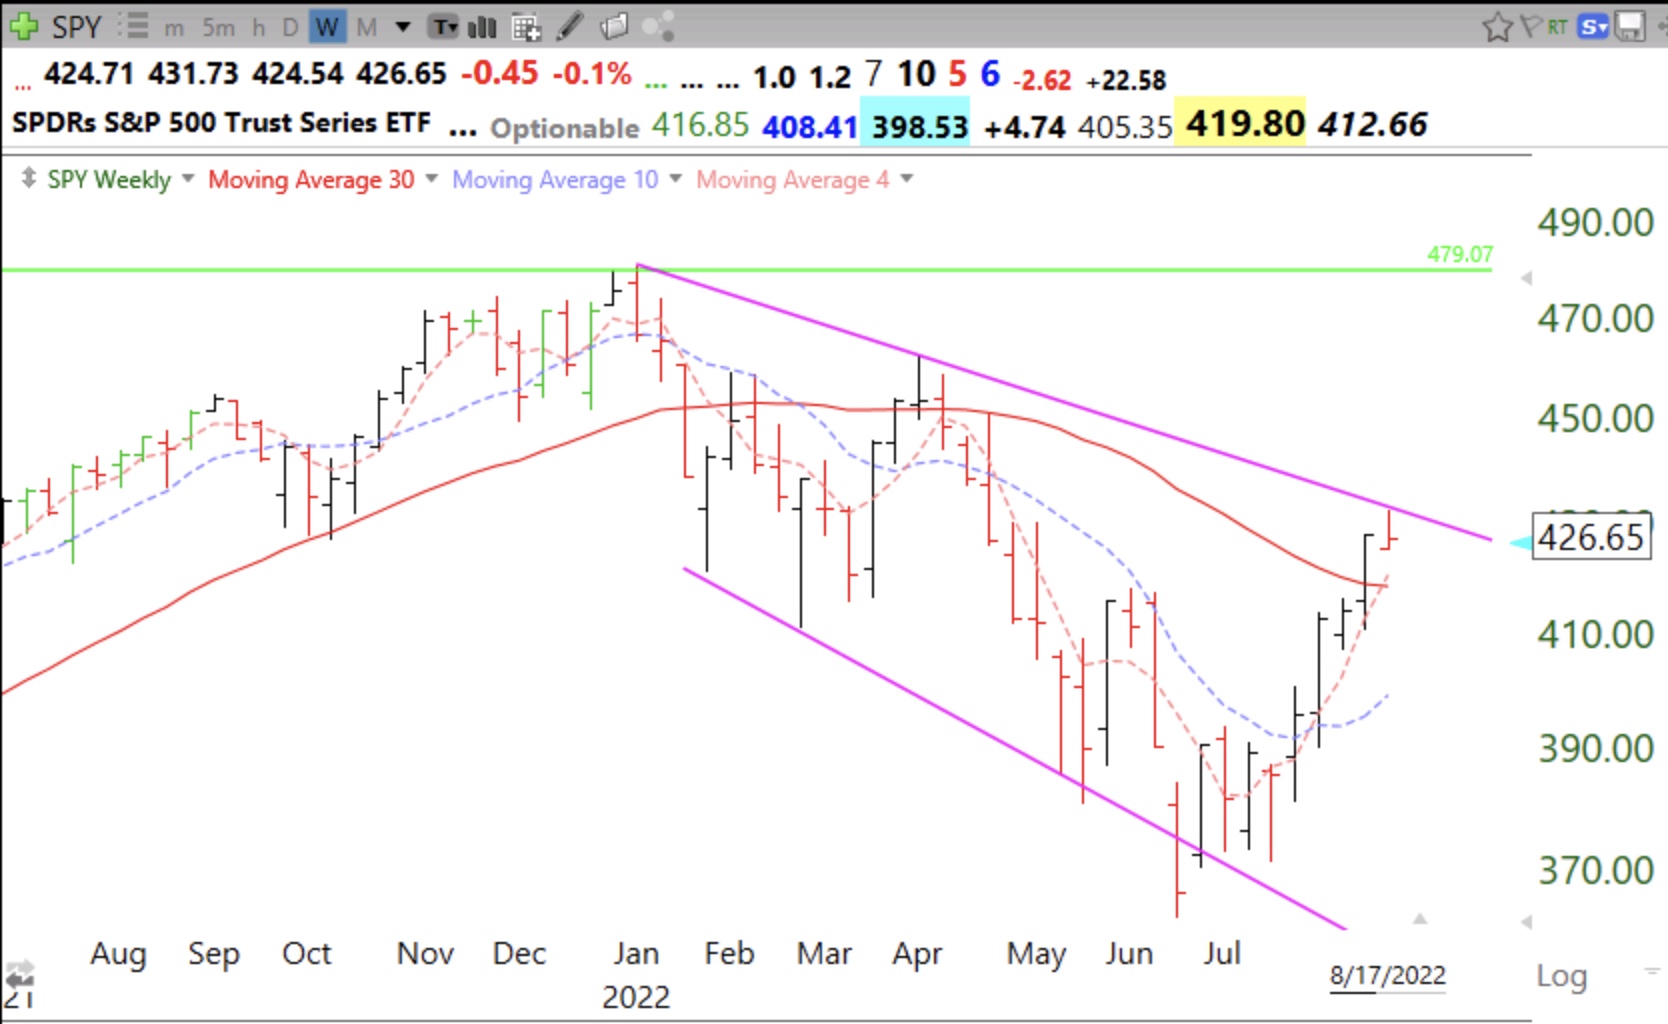
SPY is above its 30 week average (solid red line) but has hit a wall at its descending down-trend line. It is also floating above its 4 week average (red dotted line), a sign of being extended. If SPY should close back below its 30 week average it could signal another vicious leg down. Look what happened last April. Stay tuned and remain on defense…..
Thank you Dr. Wish for your time and sharing your findings.
Thank you for your kind thoughts.