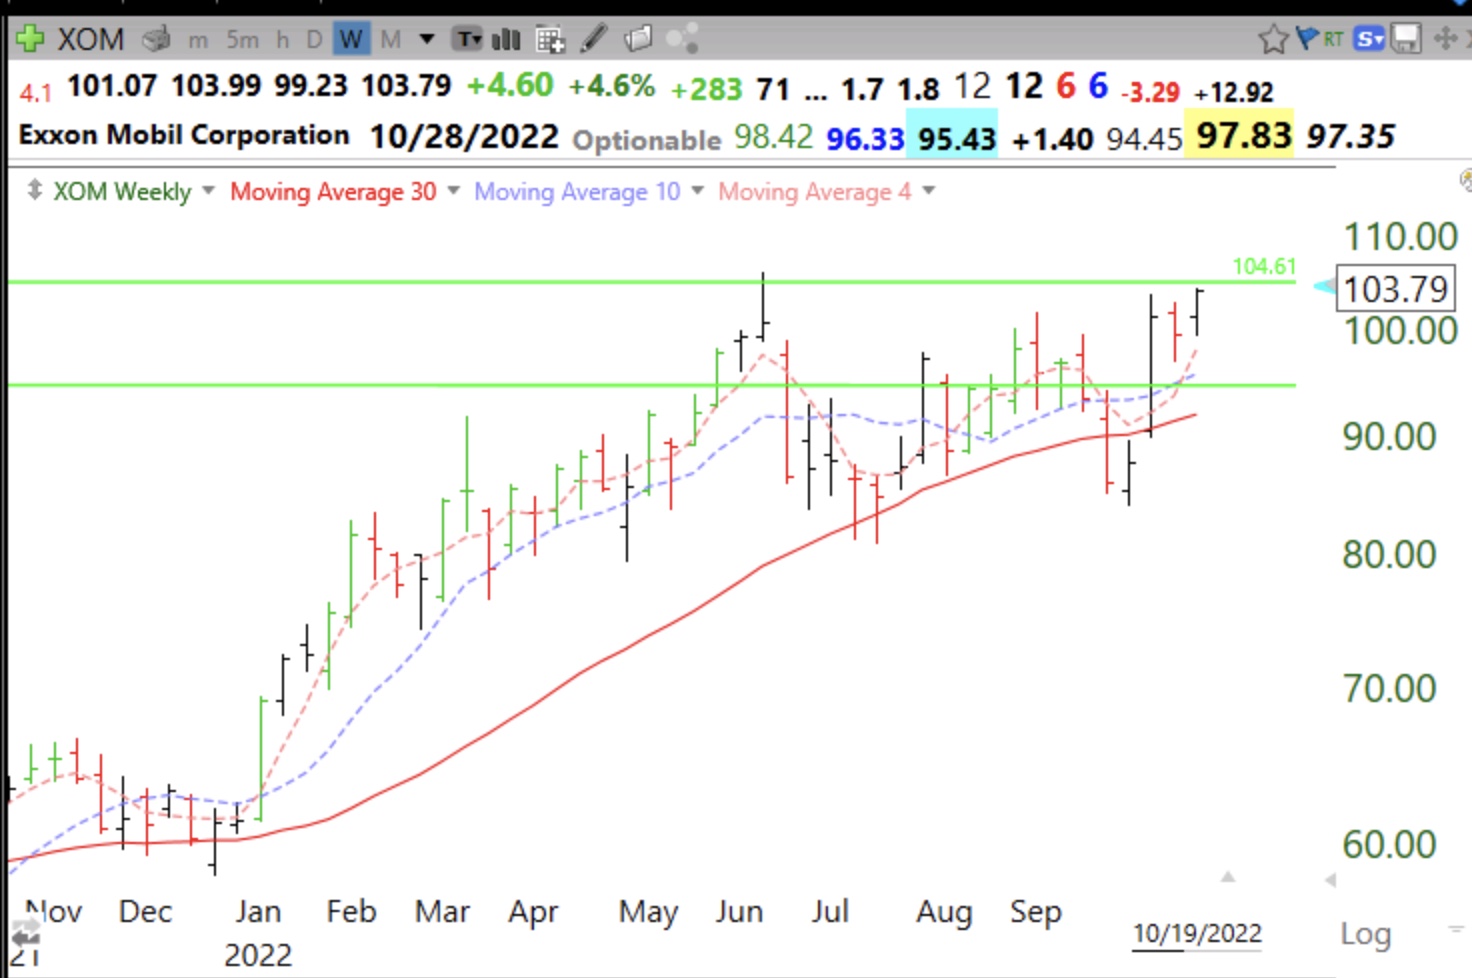
A close above 104.61 would be a green line break-out (GLB) to an all-time high. See if it does so on above average trading volume. Comp rating= 99, RS=97
2 thoughts on “Blog Post: Day 37 of $QQQ short term down-trend; Hard to believe, but $XOM is approaching GLB, see weekly chart”
I’m confused. You referred to Exxon as a GLB candidate but you’re using a weekly chart. I thought you used monthly charts. Also you say the ATH is 104.61 and the highest price looks to be 105.57. Please explain. Thank you
Loading...
The green line is drawn on the monthly chart and is then present on all time frames. The green line was drawn at the ATH of 104.61 and when it trades above the green line to 105.57, I do not move the green line up as it was a failed break-out. I might buy if it retakes the green line or goes past 105.57. Hope this clears things up for you. Great question.
I’m confused. You referred to Exxon as a GLB candidate but you’re using a weekly chart. I thought you used monthly charts. Also you say the ATH is 104.61 and the highest price looks to be 105.57. Please explain. Thank you
The green line is drawn on the monthly chart and is then present on all time frames. The green line was drawn at the ATH of 104.61 and when it trades above the green line to 105.57, I do not move the green line up as it was a failed break-out. I might buy if it retakes the green line or goes past 105.57. Hope this clears things up for you. Great question.