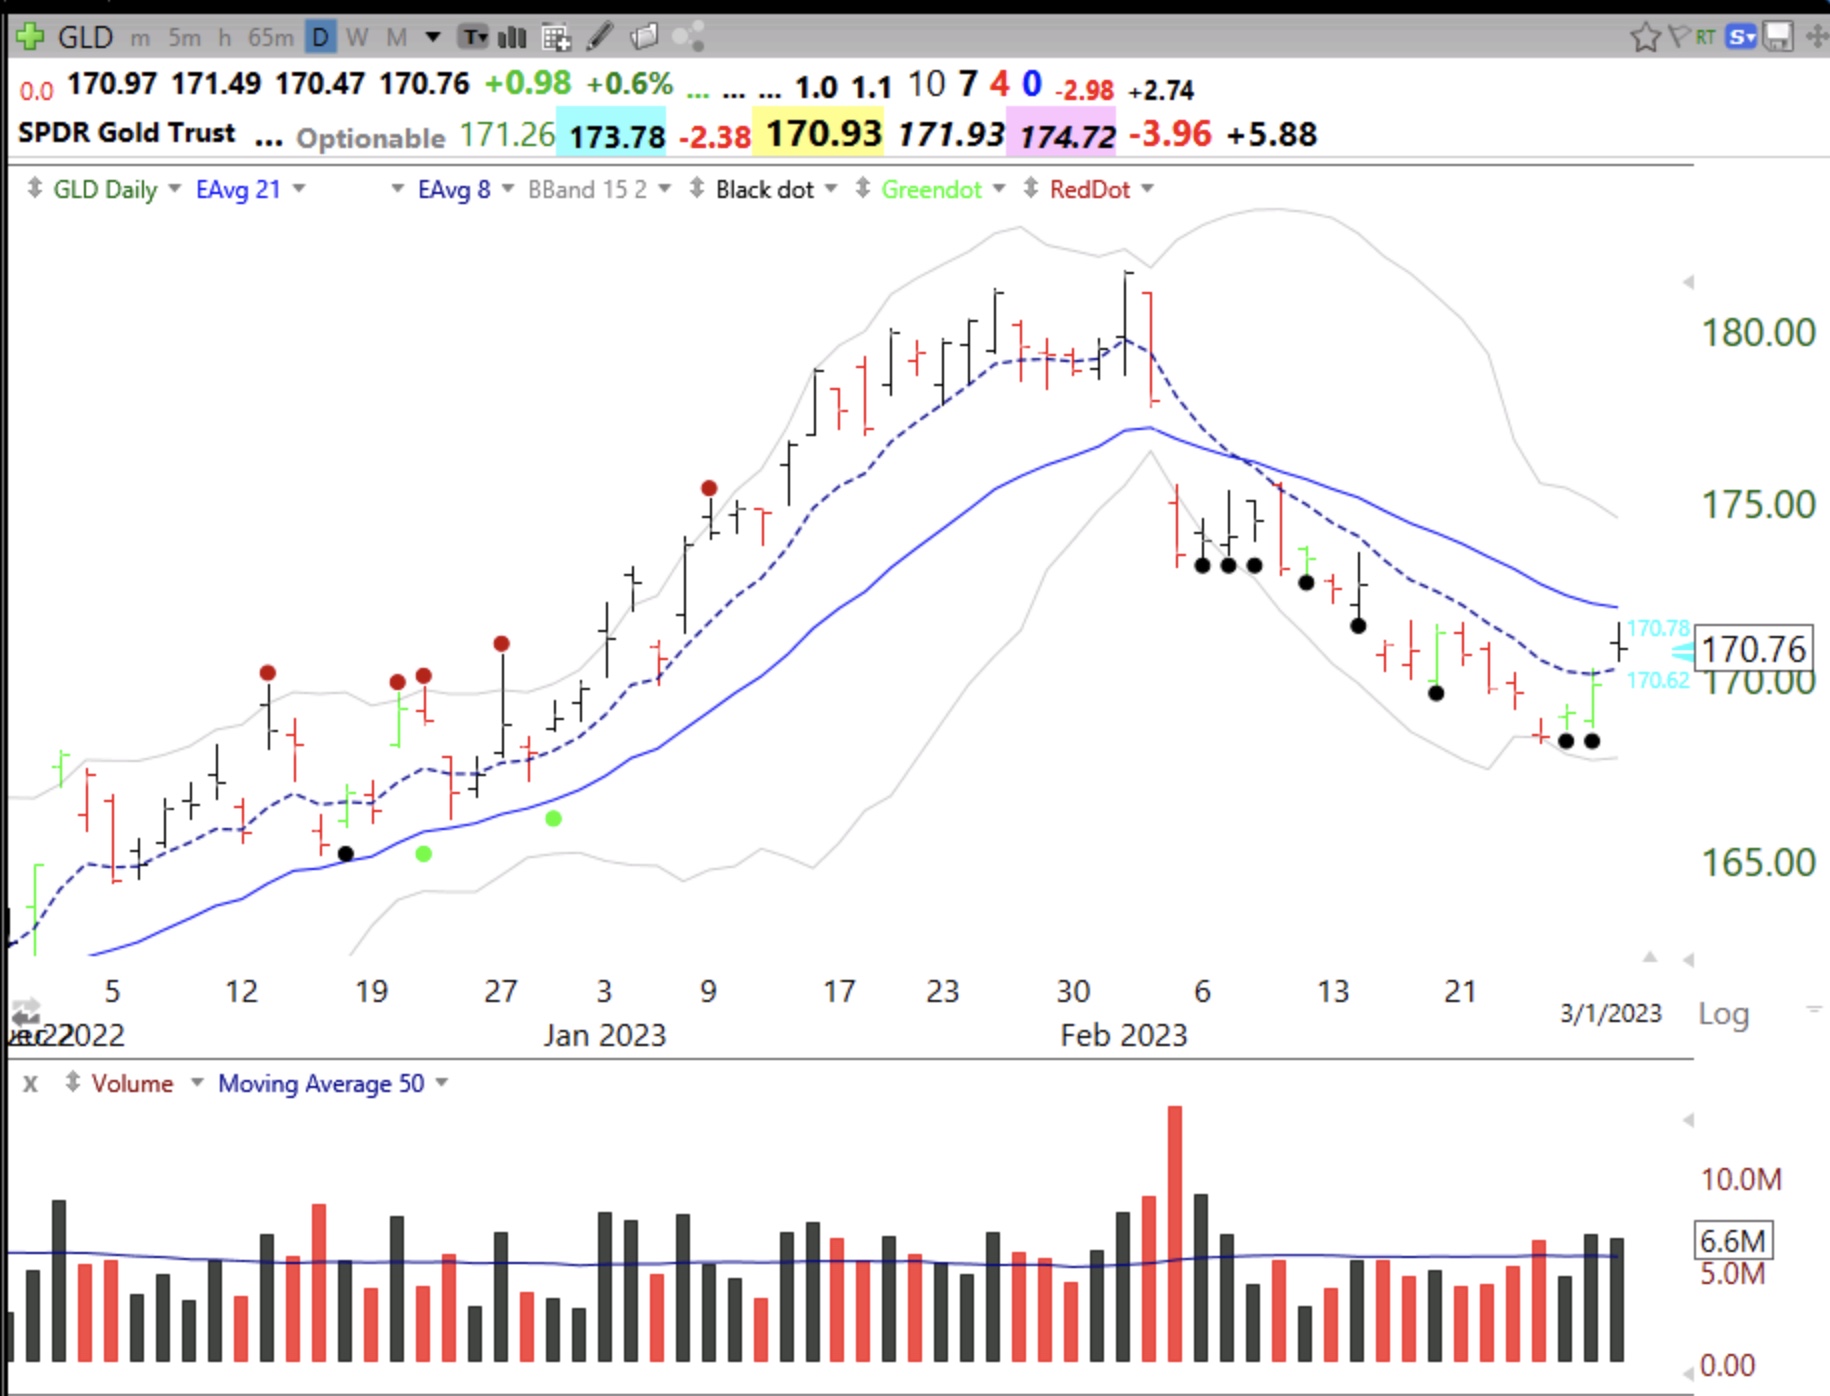
This daily chart shows that GLD has now retaken its 8 EMA (dotted line) for the first time since February 1, at the recent top. Volume was above average the past 2 days as it rose. It bears watching to see if GLD can mount a new rise. The next hurdle is the 21 EMA (solid line). Note during the December and January rise, the 8 EMA consistently rose above the 21 EMA. The 8 EMA leads the way.