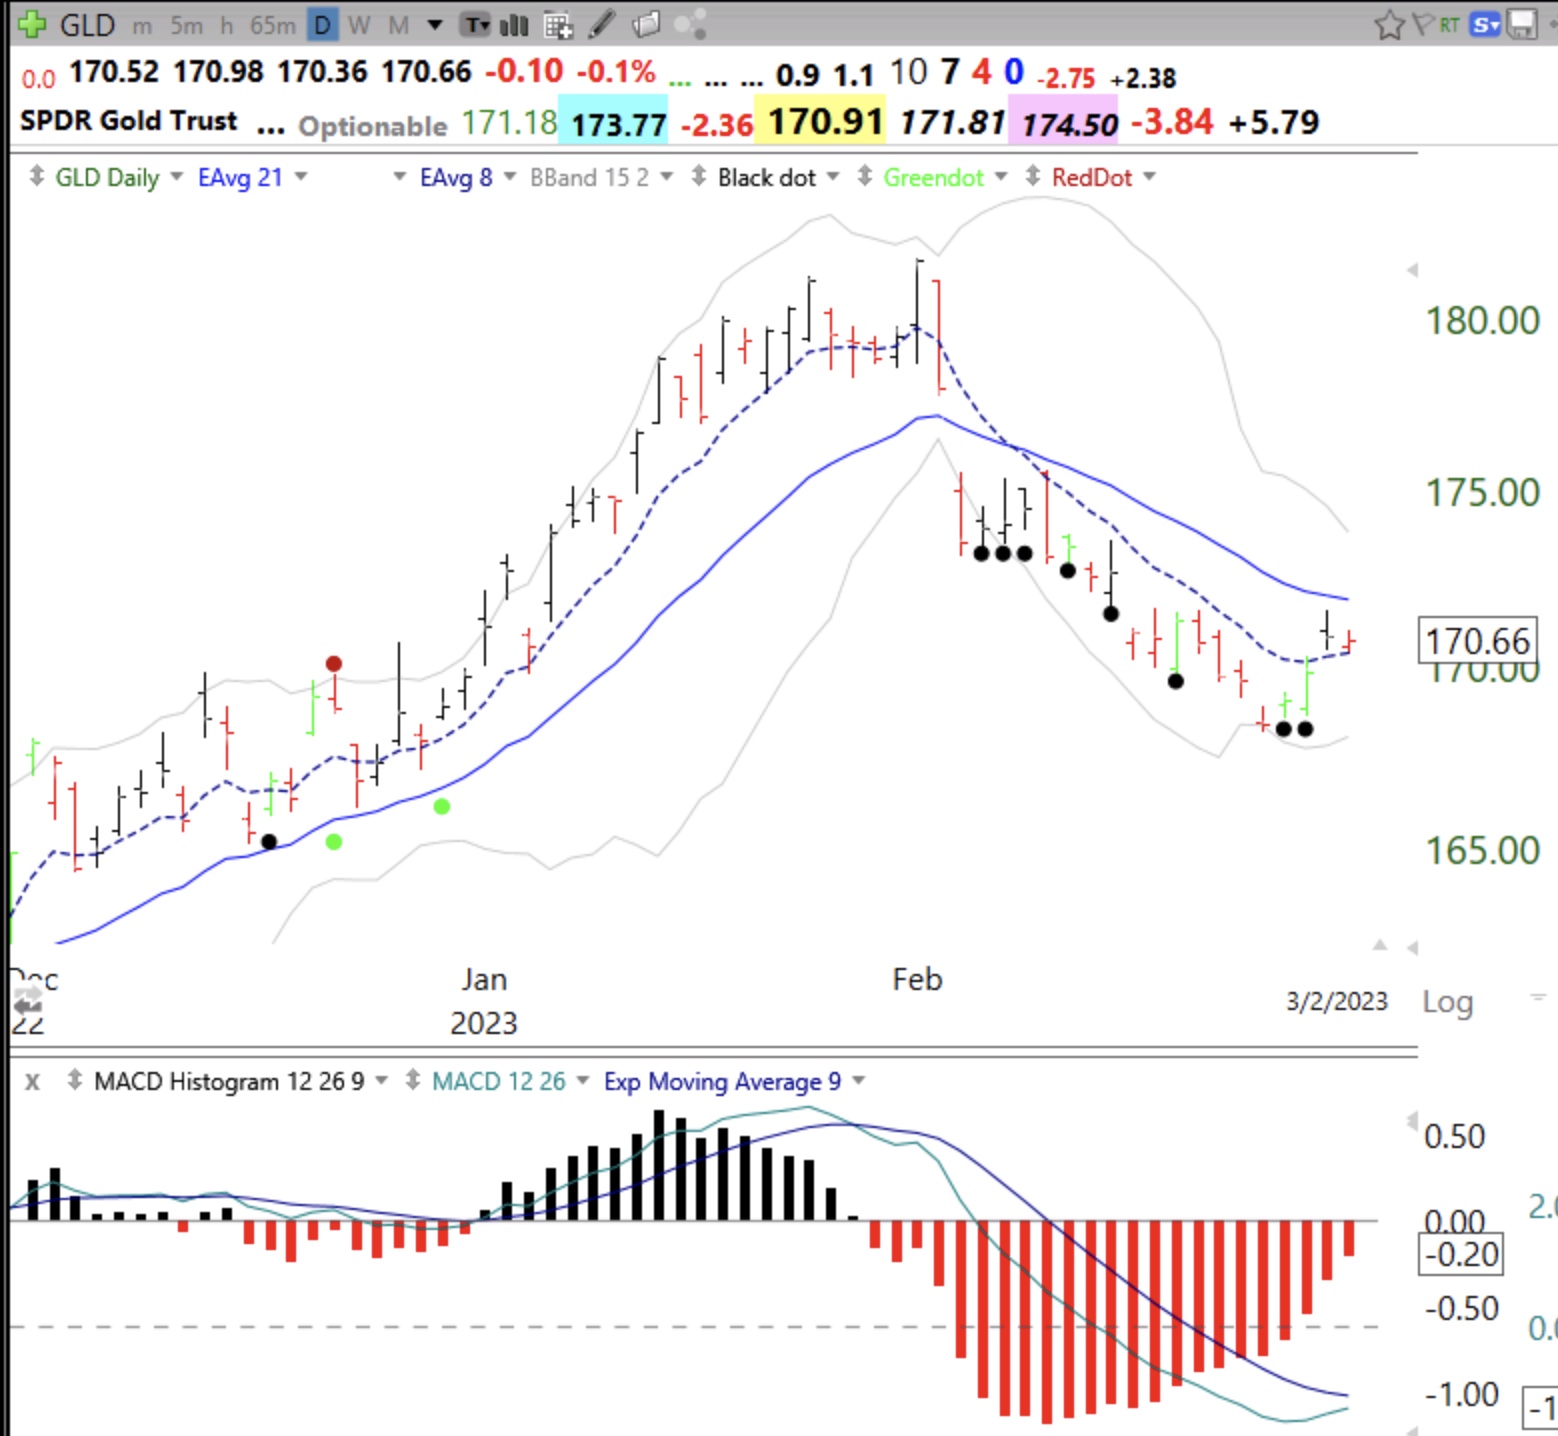
The MACD histograms often show a change in trend before it is evident in the price. Look at how the histogram has been steadily rising as price declines=positive divergence.
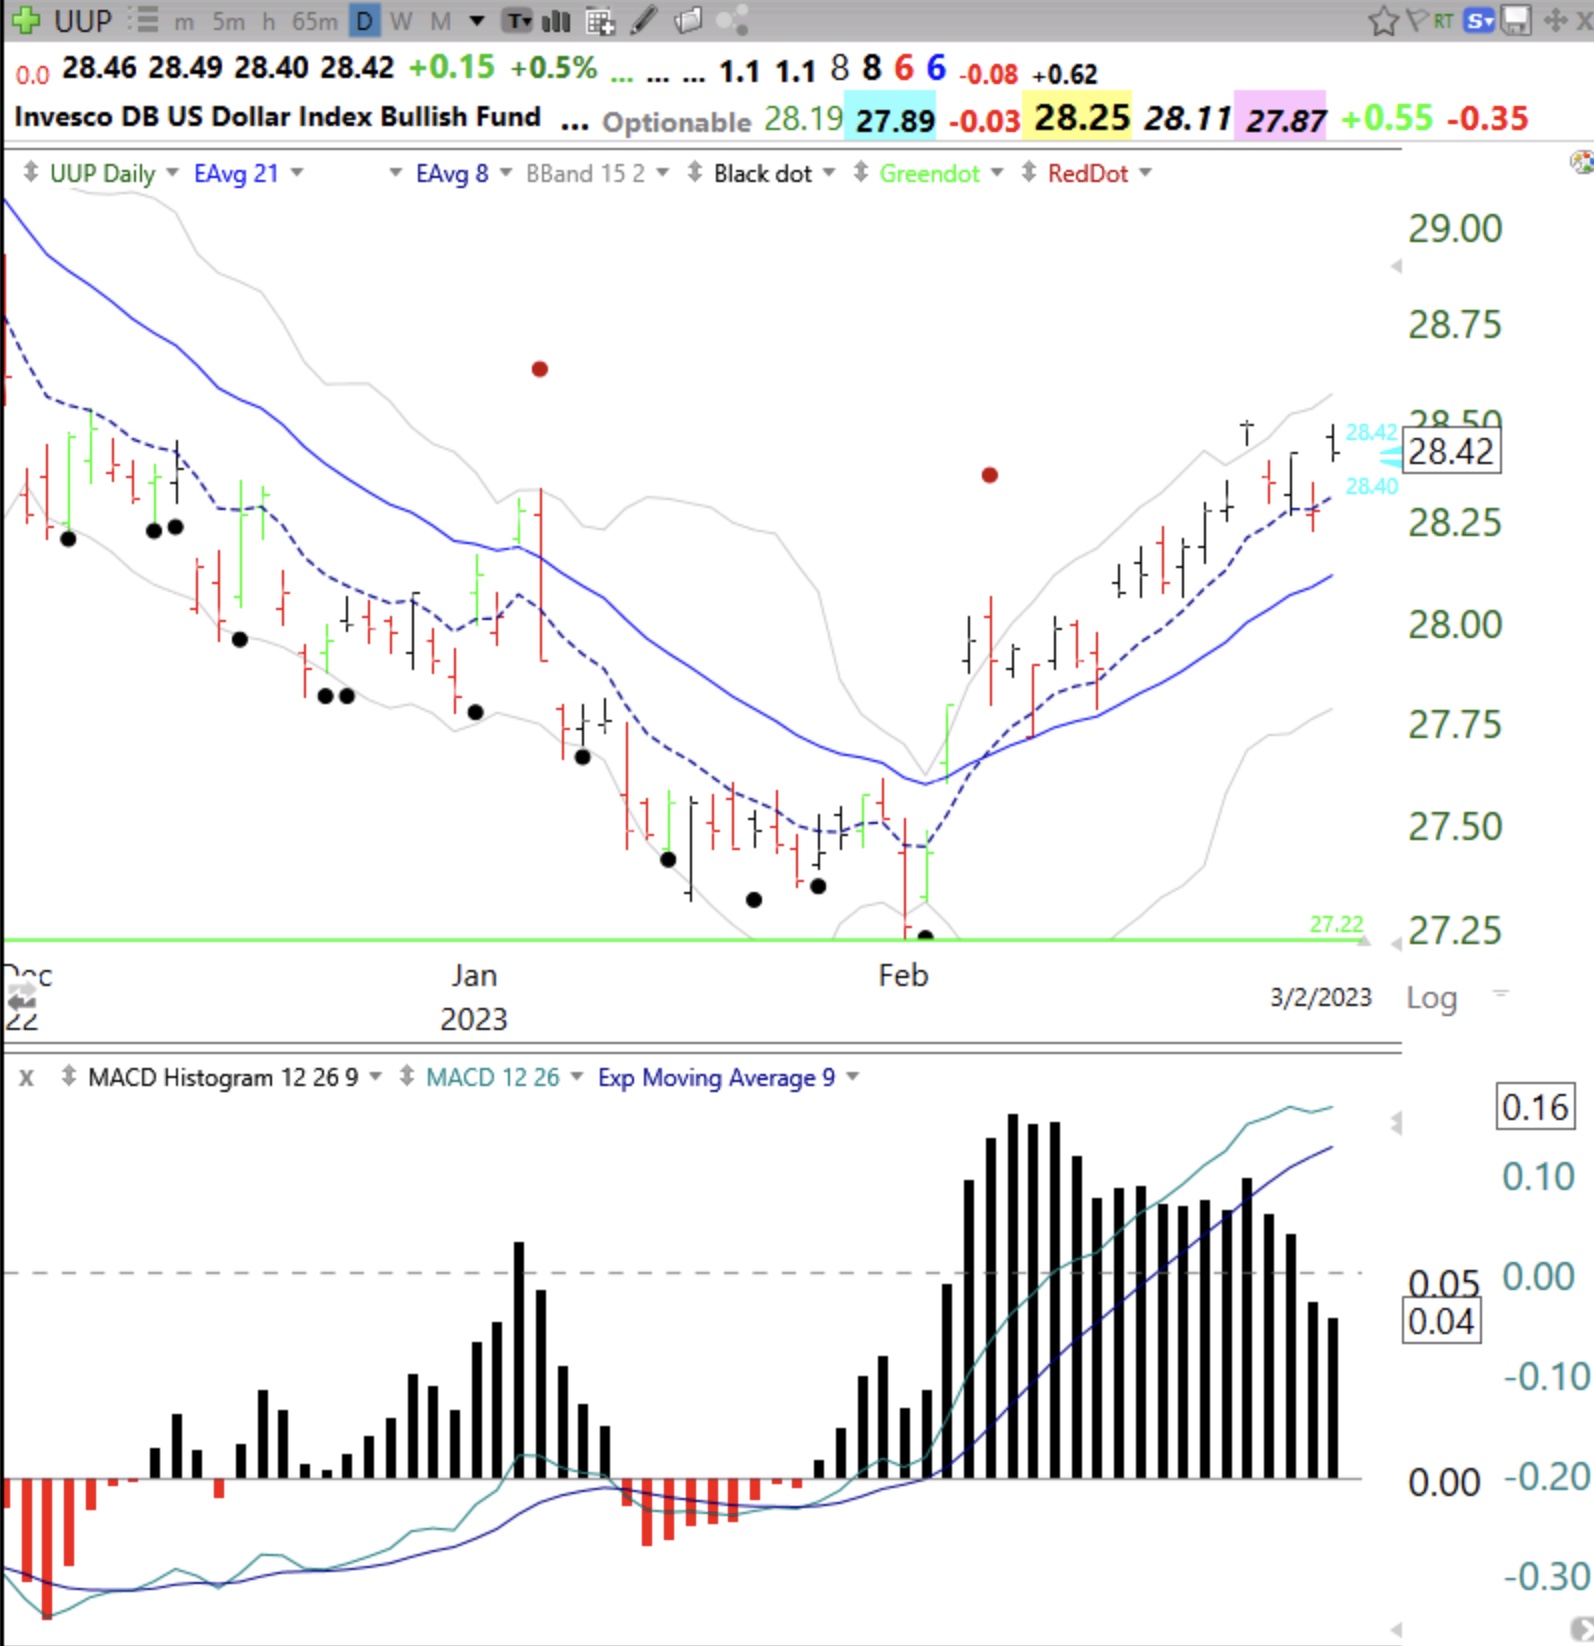
In contrast, the dollar, UUP, is showing a negative divergence.
Gold rises as the dollar falls. Compare the two charts. As the value of the dollar declines, it takes more dollars to buy an ounce of gold.