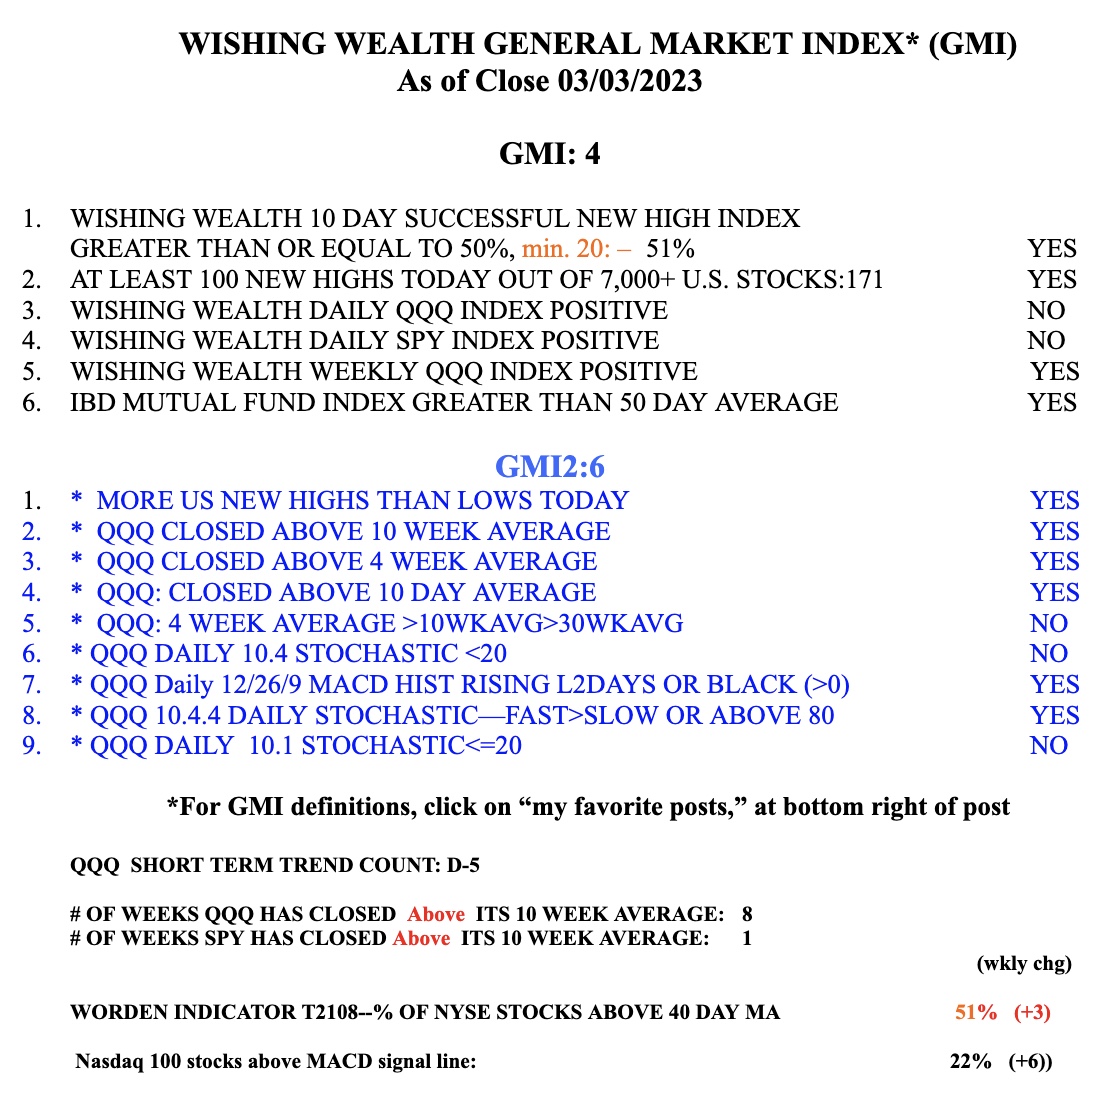
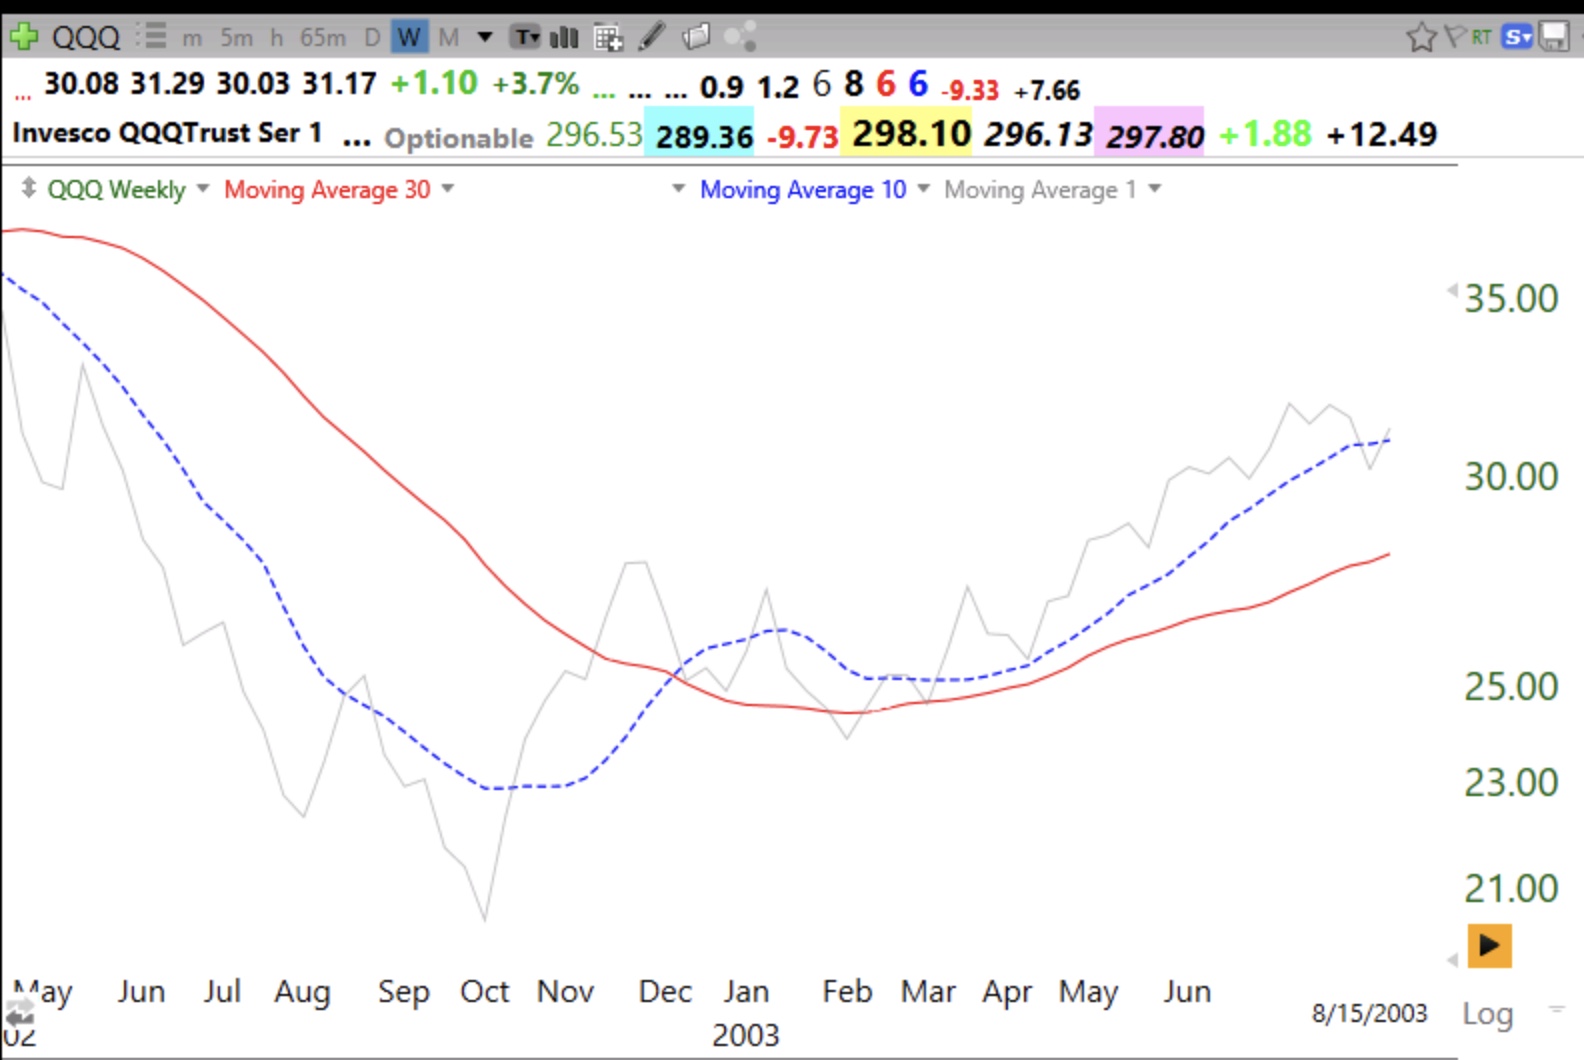
After coming close to beginning a new longer term decline, the market appears to be getting stronger. MY QQQ short term trend indicator could turn up with a good day on Monday. This 10:30 weekly chart of QQQ shows its 10 week average (dotted line) is now above its 30 week average (red line). This pattern has been true for DIA and SPY for several weeks. This pattern of the 10 week above the 30 week typically indicates the beginning of a major longer term up-trend. The gray line is the weekly close. If the gray line should return below the two averages and lead the 10 week below the 30 week it would likely signal the end of the new up-trend.
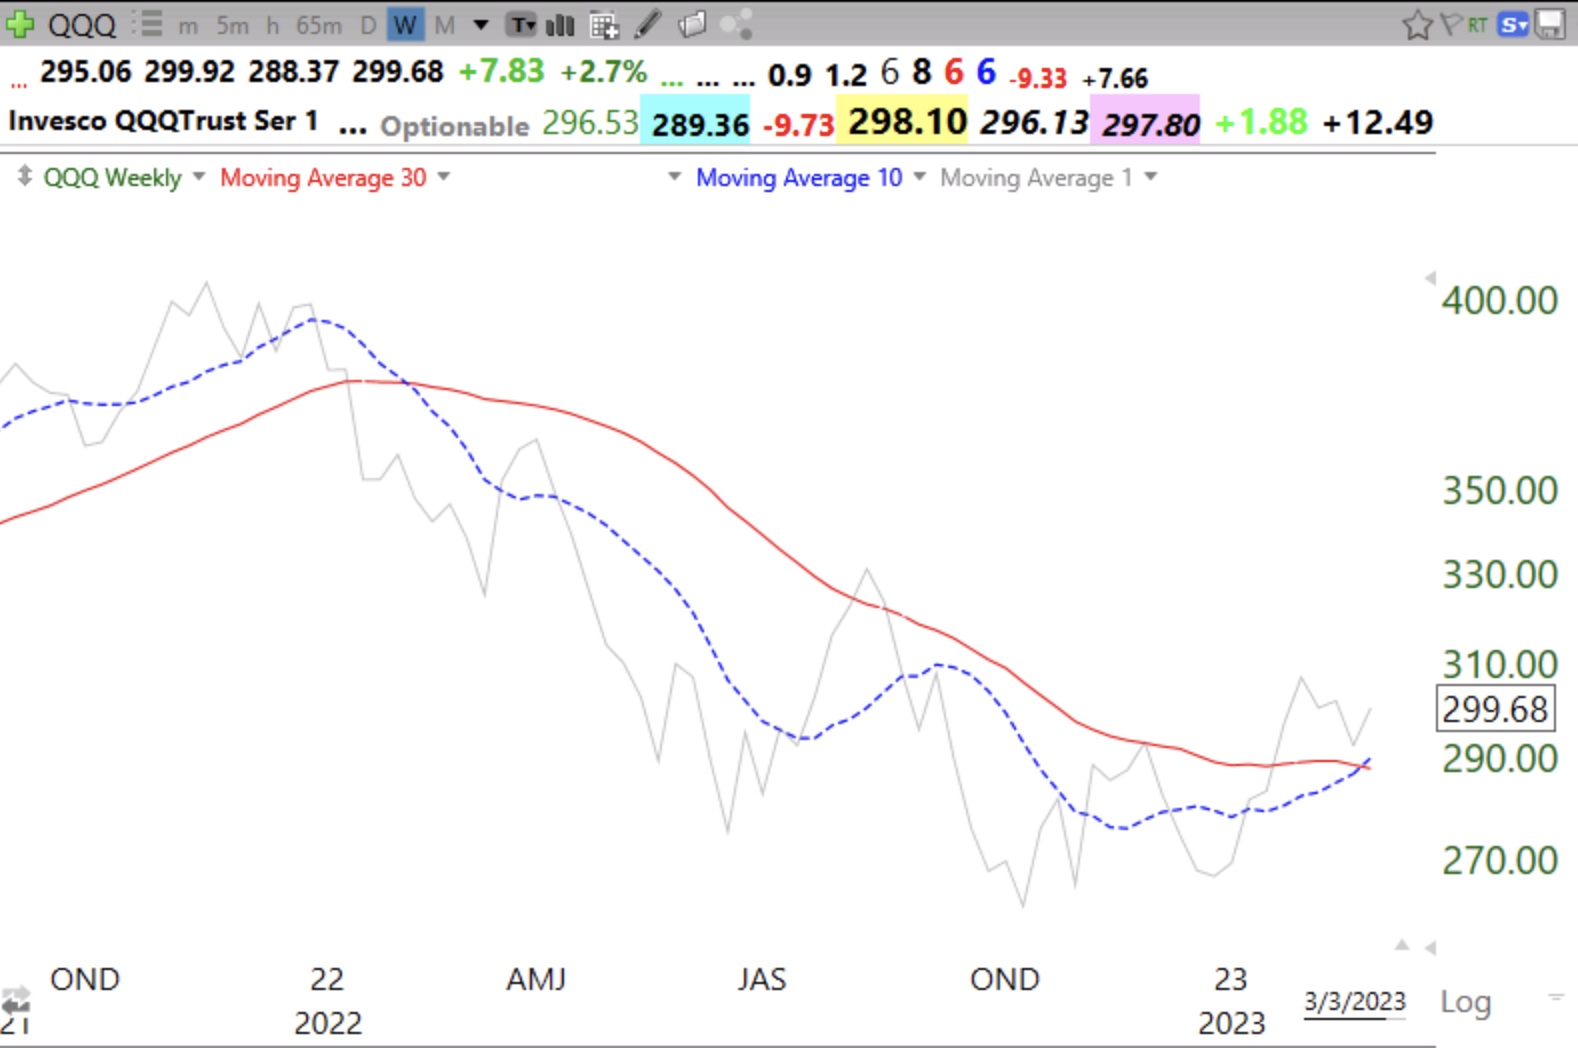
Here is the 2020 bottom.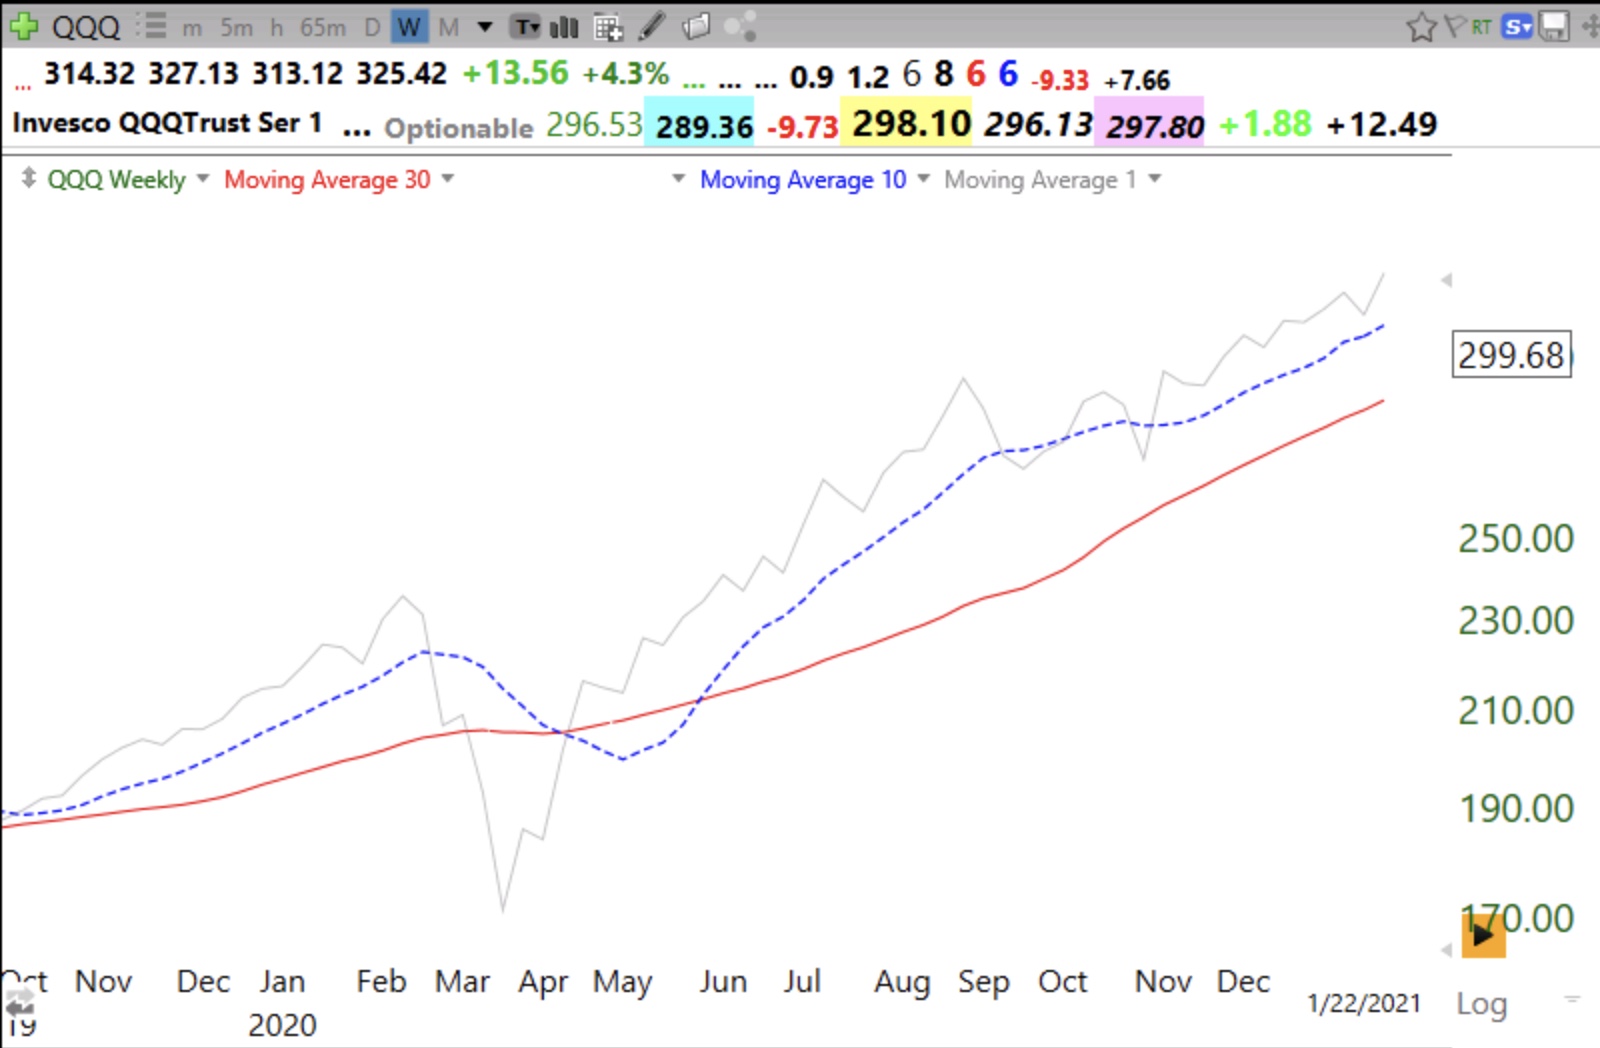
And the bottom in 2008-9.
And the 2002 bottom.
The GMI continues to flash Green and is at 4 (of 6).