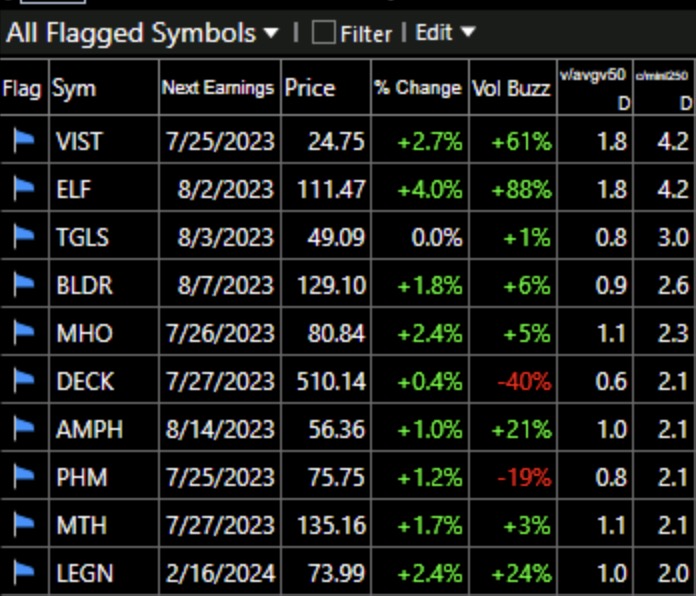
These stocks from my IBD/MS watchlist all at least doubled their lows the past year. See list sorted by last column, close/low price past 250 days. Note the predominance of construction stocks.
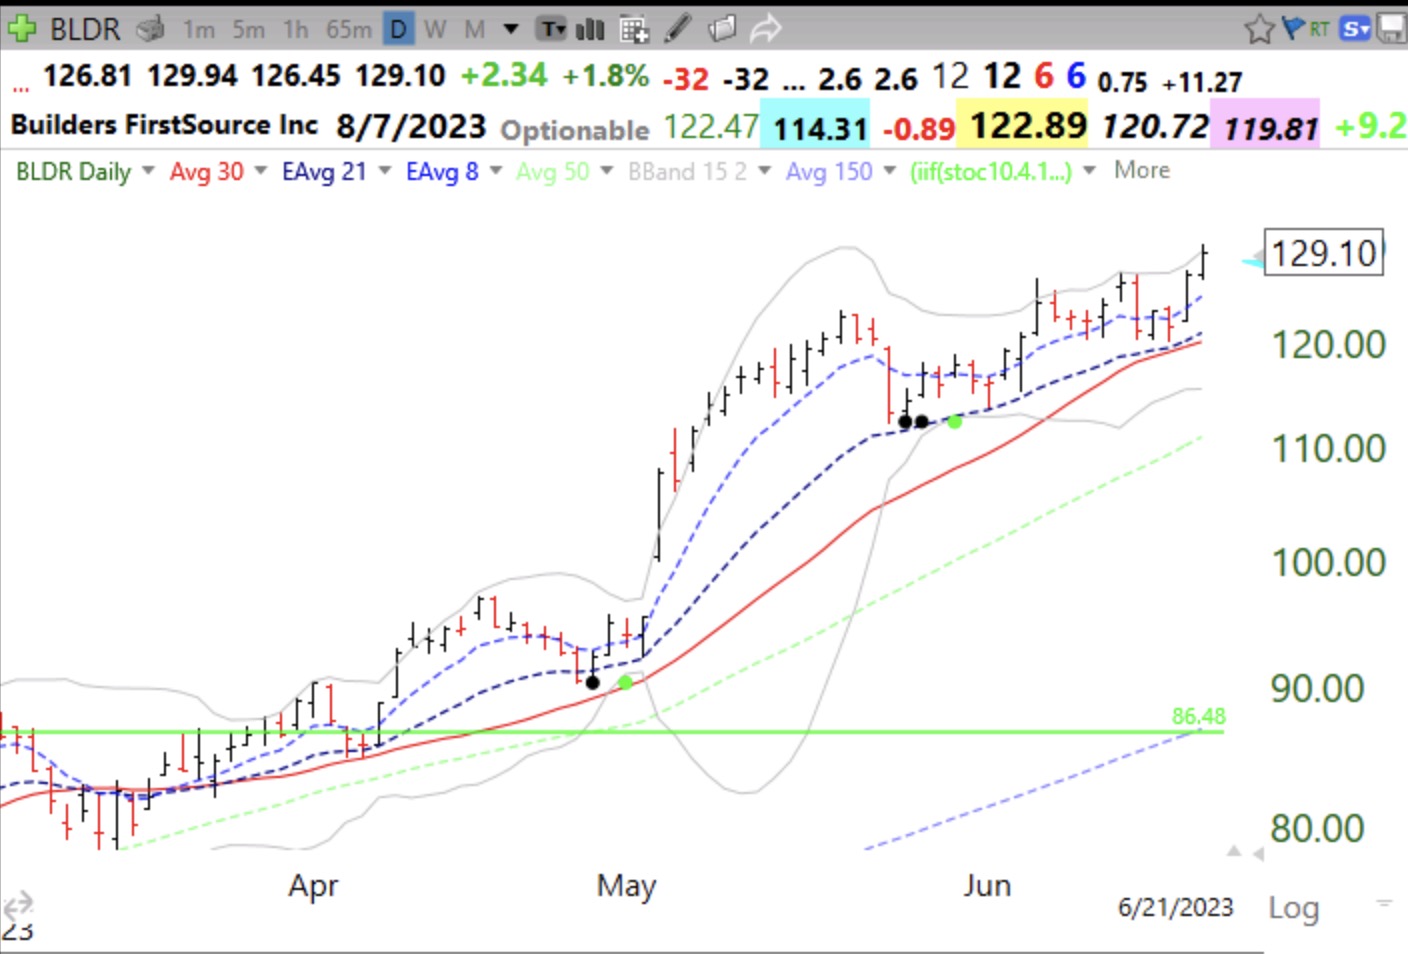
This daily chart shows my new oversold bounce (OSB) indictor, designated by a black dot. Note also the green line break-out (GLB) last April.
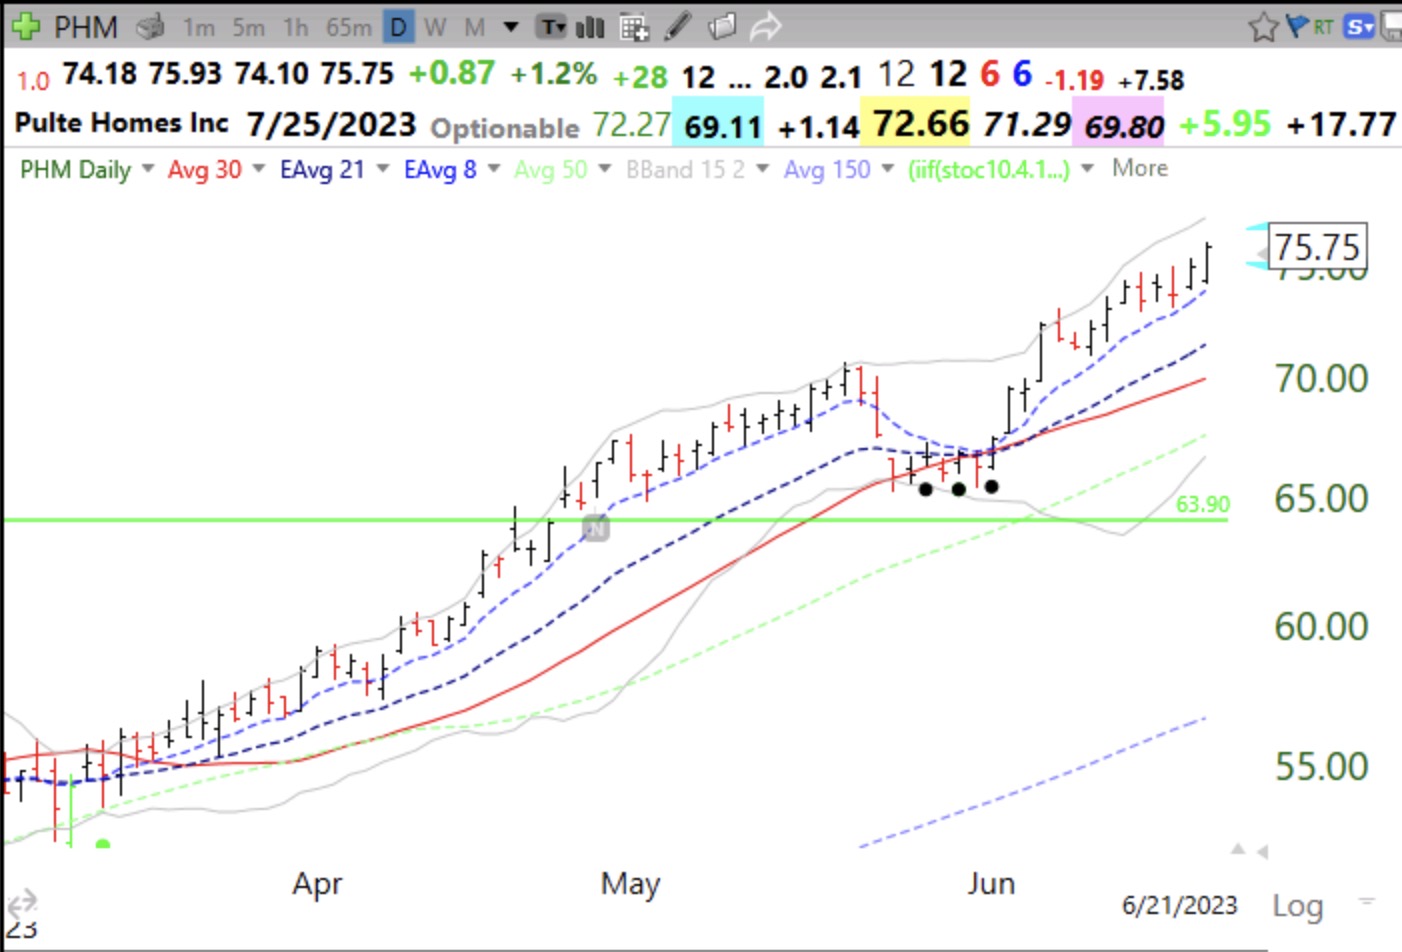
And PHM, black dot and GLB!