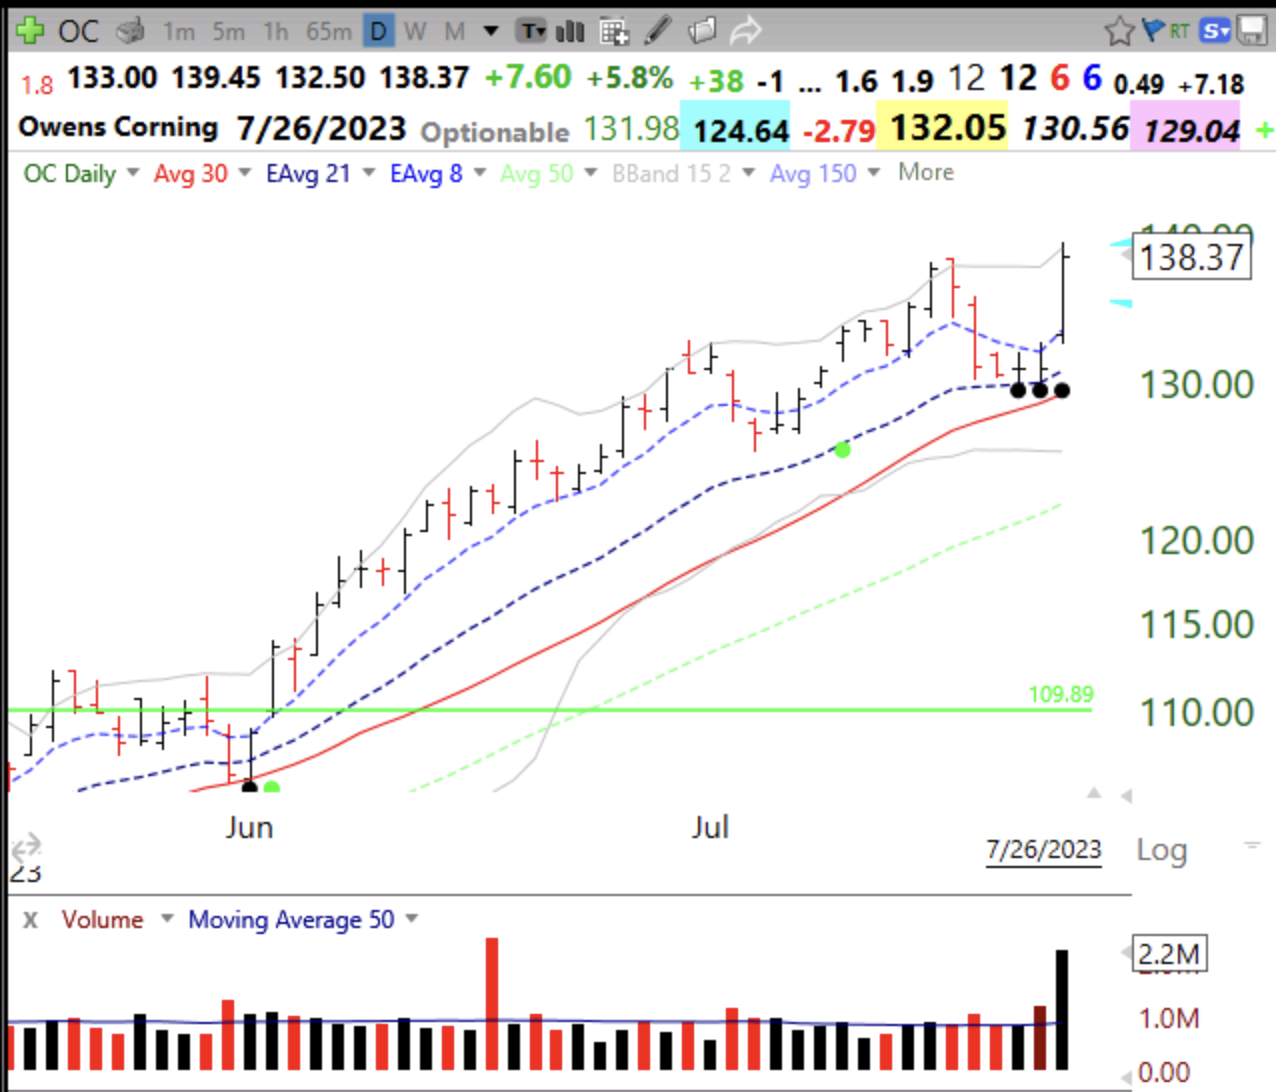
OC came up on my scan because it had an OSB (oversold bounce) shown by several black dots. It rose on above average volume to an ATH (all-time high). It also met my criteria for a weekly green bar. Note the GLB (green line break-out) in June.
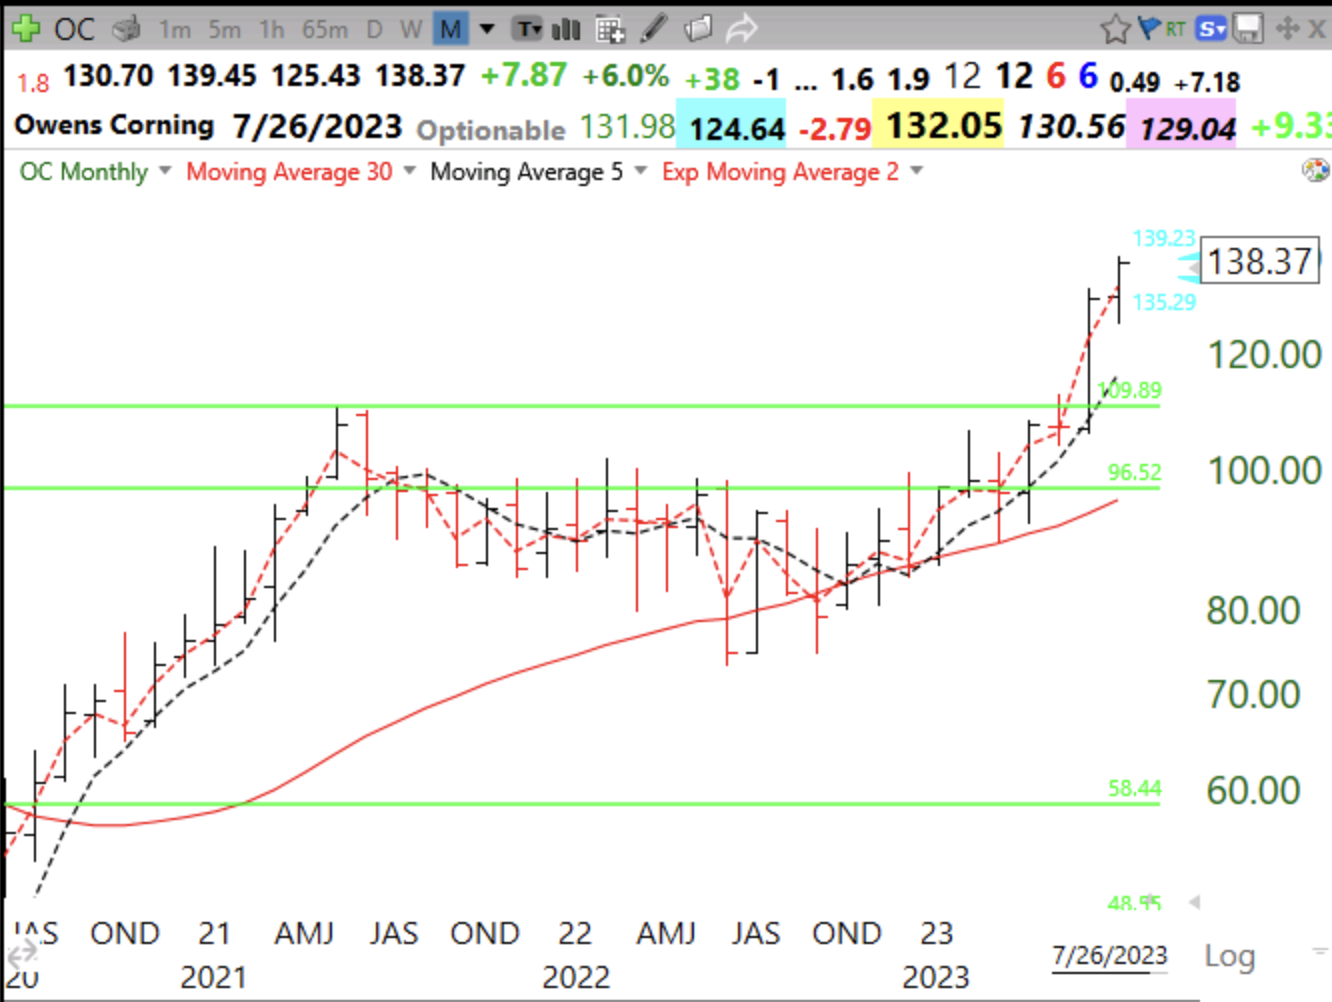
Here is its monthly chart.
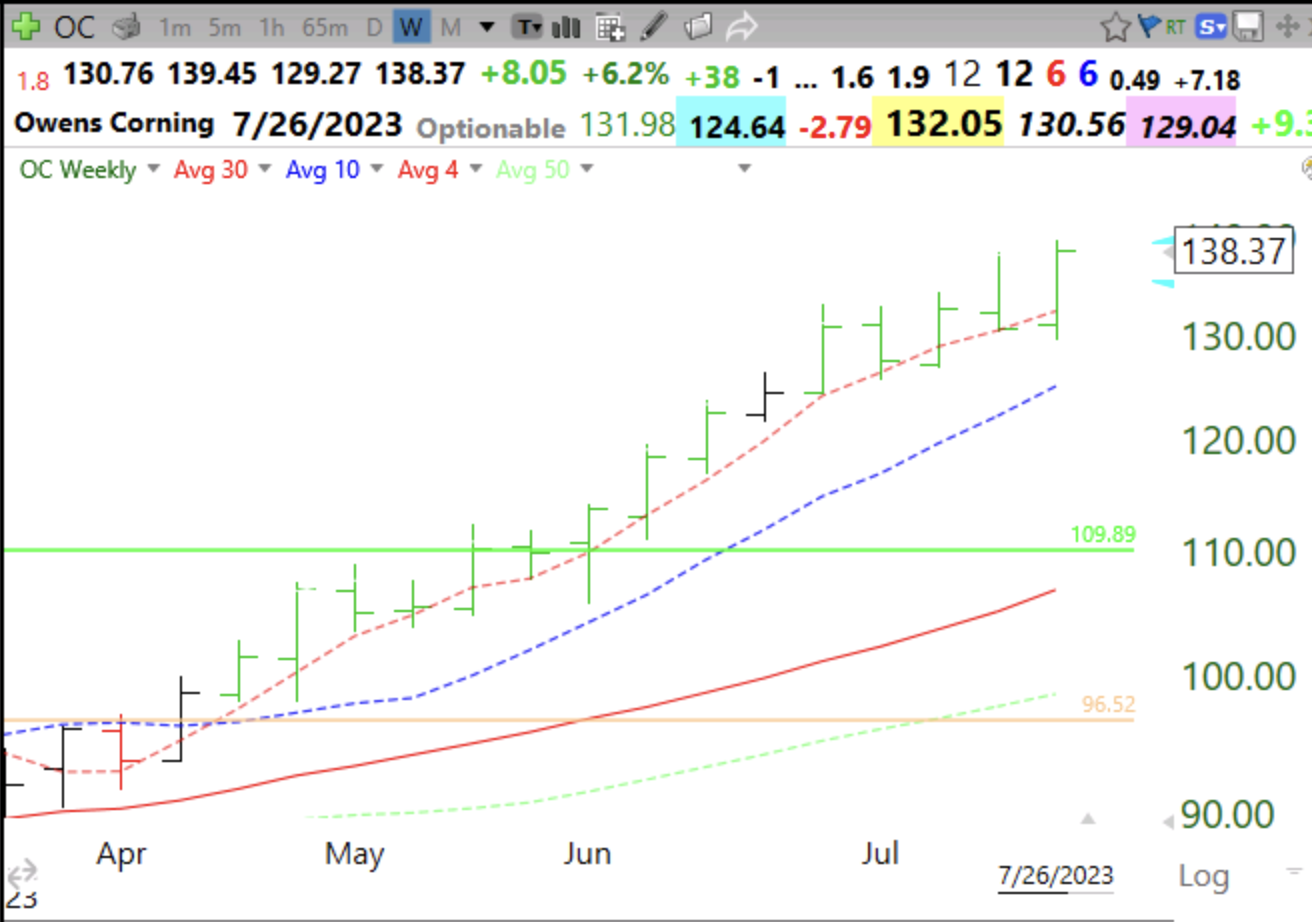
And its weekly chart with a green bar. A green bar means it bounced up off of its rising 4 wk avg and its relative strength reached a 20 week high. OC has had a string of green bars. Advancing stocks hold their rising 4 week average.