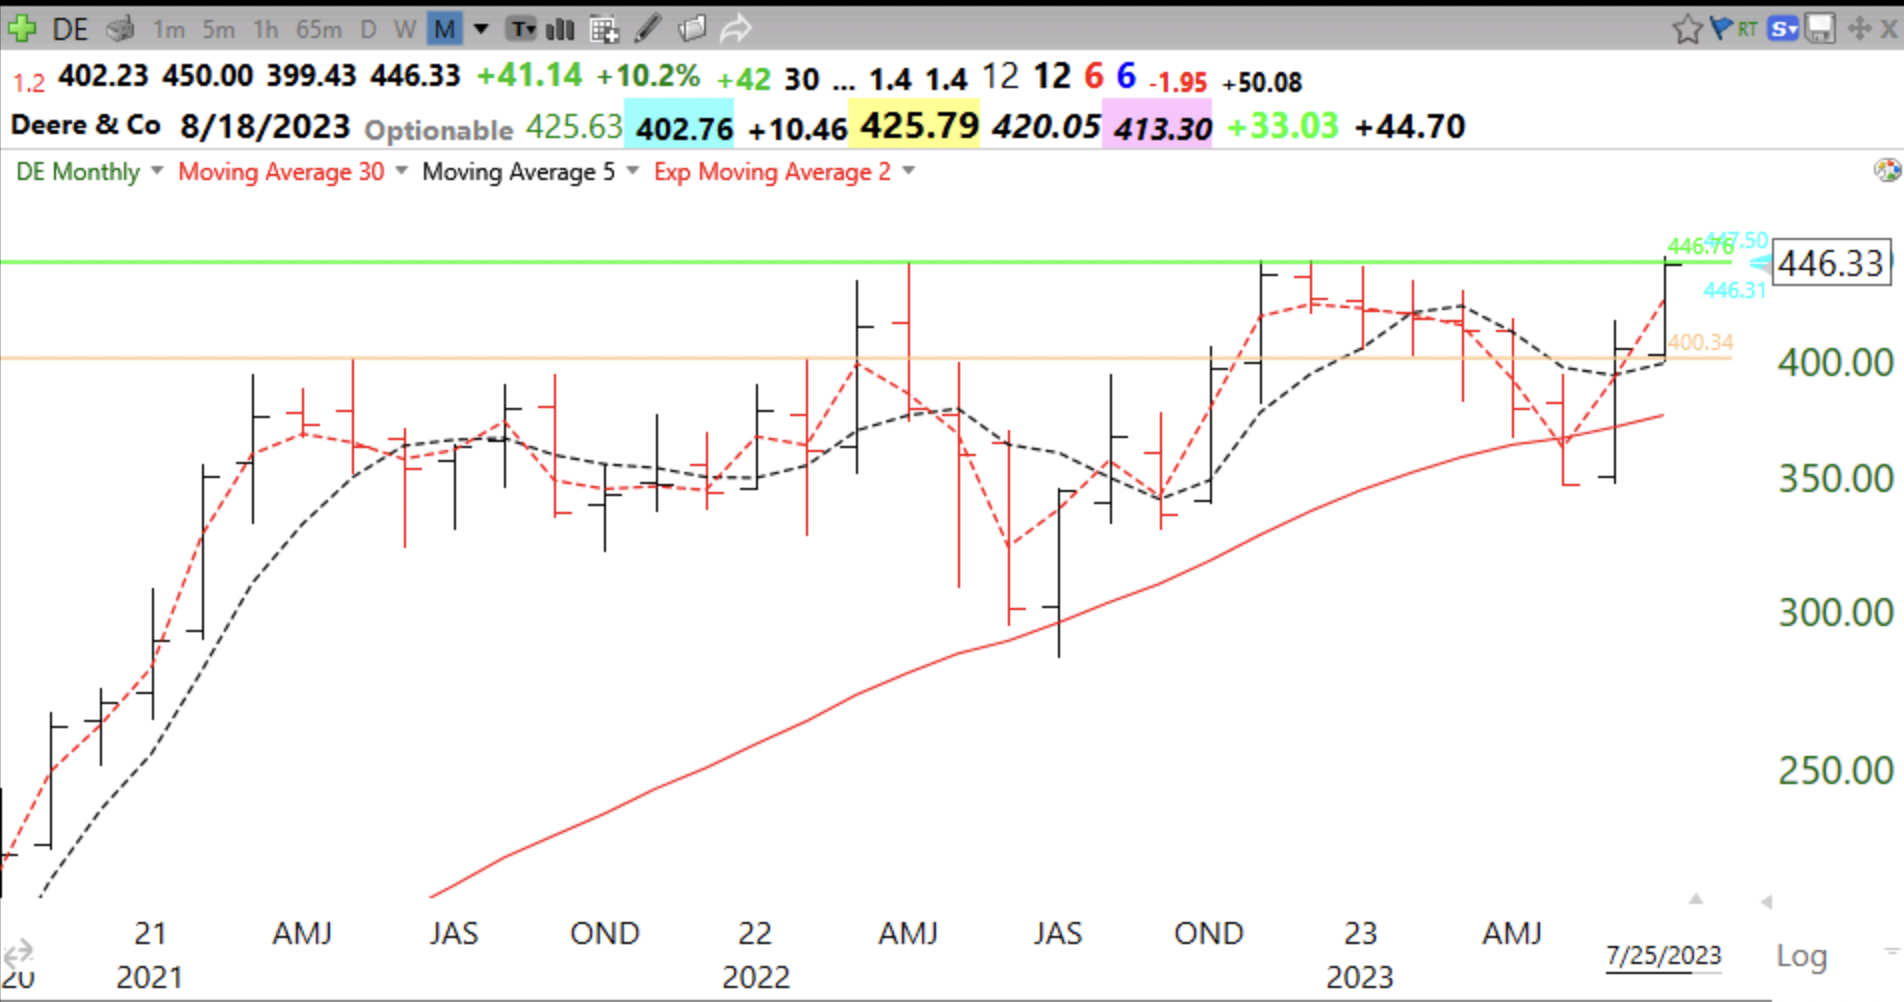
Here is DE’s monthly chart showing derivation of green line at ATH not exceeded for at least 3 months. Tan line is prior green line top. MarketSmith says Comp rating=97 with EPS=98 and RS=82.
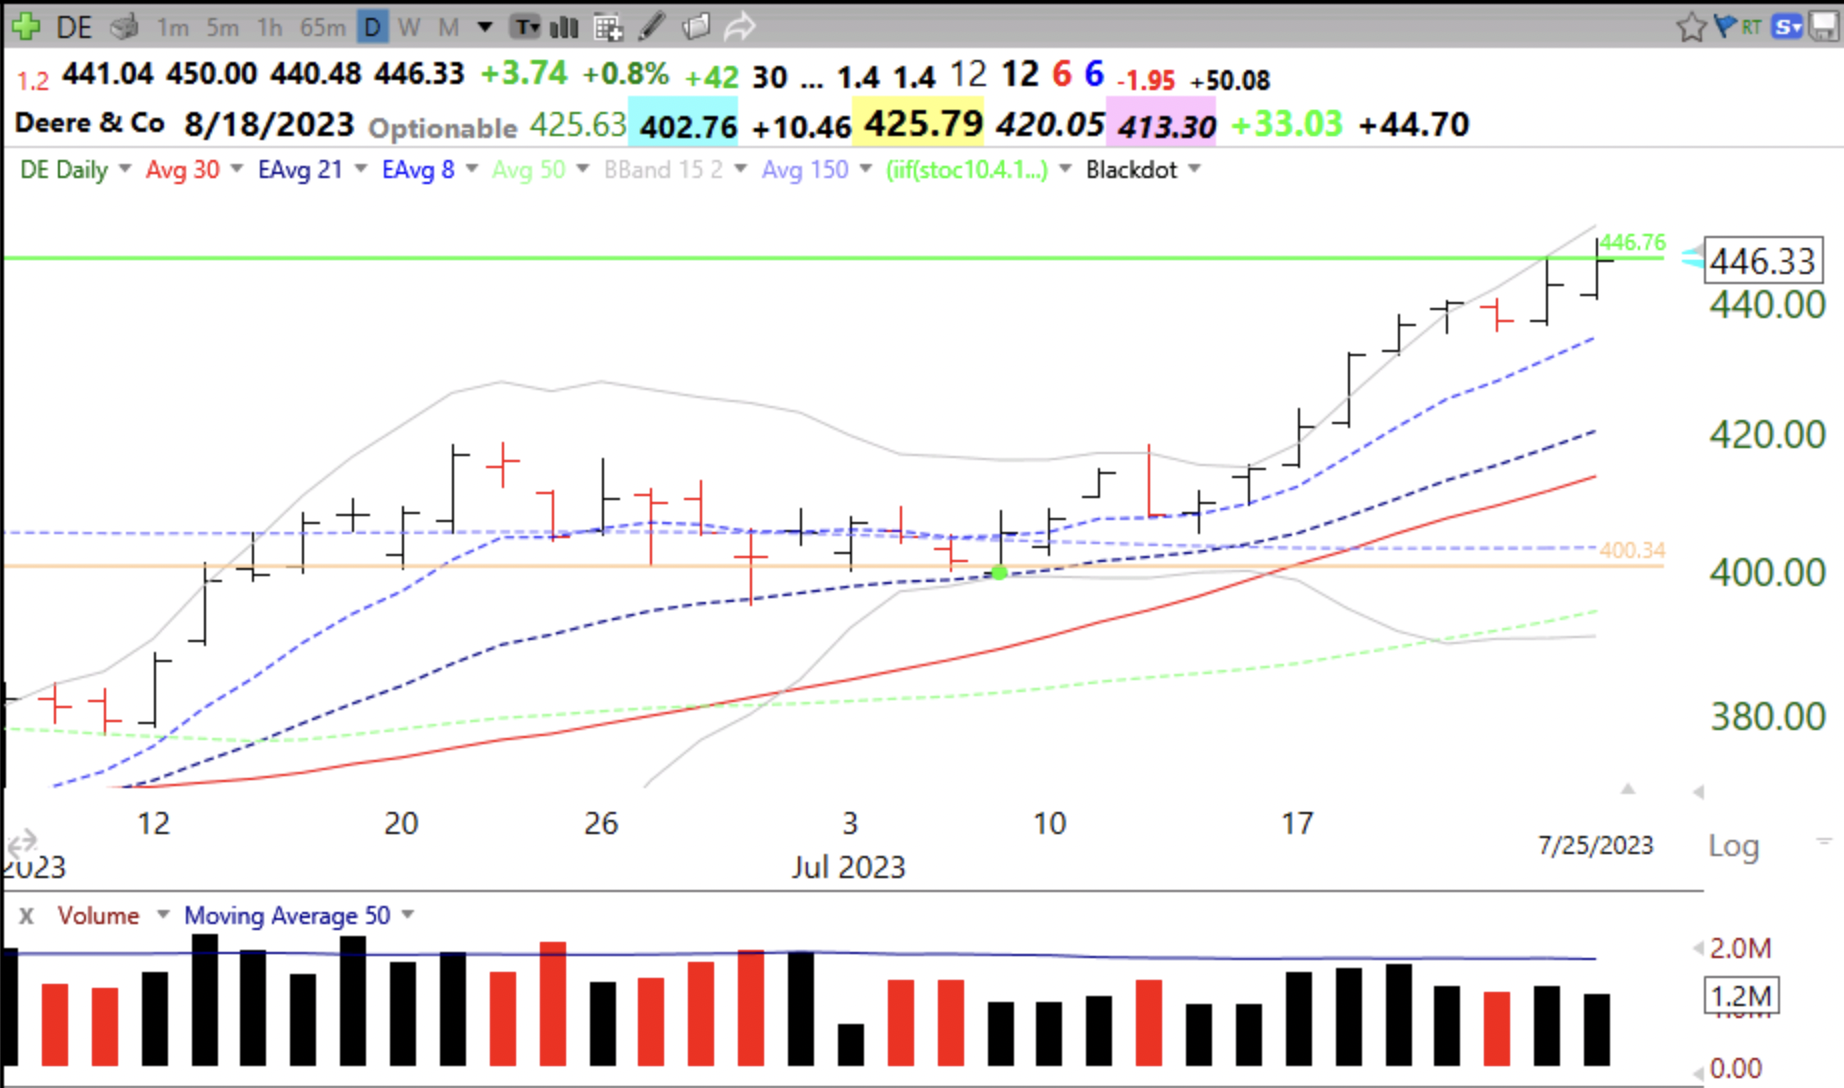
Here is its daily chart. Would like to see above average volume on any break-out.
Dr. Wish, I am mirroring your 250week hi/lo list in TC2000 and noticed that you may be counting some stocks that are no longer trading. I filtered them out by eliminating stocks that have a 0% YTD change [100 * (C / C1 – 1) <>0].
Today’s 446.33 close is already the first close above the 12/2/22 ATH weekly closing price of 445.61 – let’s see if it holds up into this week’s close.