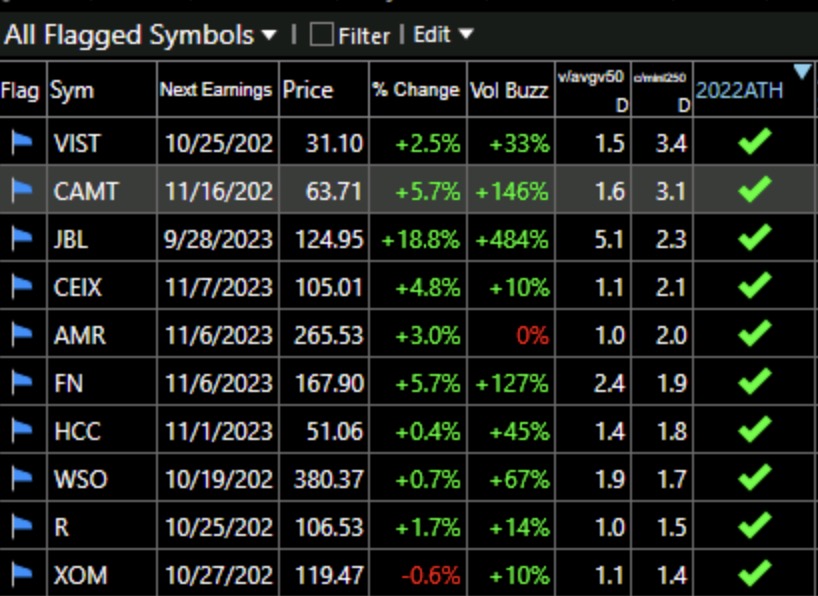
Again, 3 of them, CEIX, AMR and HCC, are in the coal industry. List is sorted by current close/lowest price past 250 days. VIST is 3.4x its yearly low.
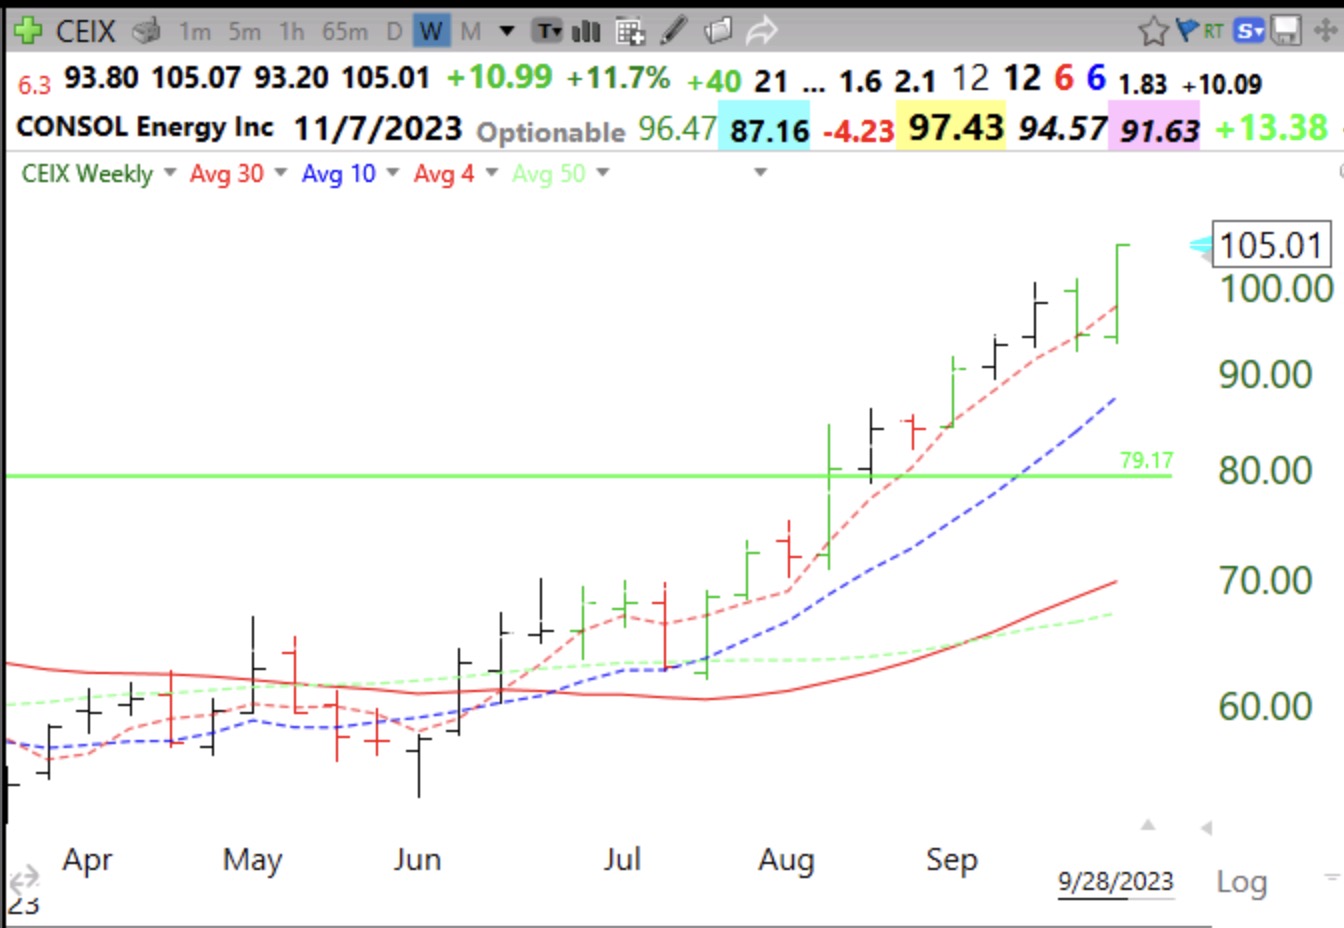
I want my students to study this weekly chart of CEIX. On September 1, my guest speaker and former student, Richard Moglen, suggested this stock as a possible rising buy and hold stock for my class to consider. I assign many of Richard’s videos to my students.
CEIX, in fact, exemplifies a number of the technical characteristics of advancing stocks that I look for. First, the 4wk avg>10wk avg>30 wk avg. It is in a Stage 2 up-trend. It also has a yellow band pattern, having also closed above its 10 week average repeatedly. It also has several weekly green bars, having bounced up off of its rising 4 week average. And most important, it is above its last green line top, reaching ATHs, and had a GLB (green line break-out) in August.
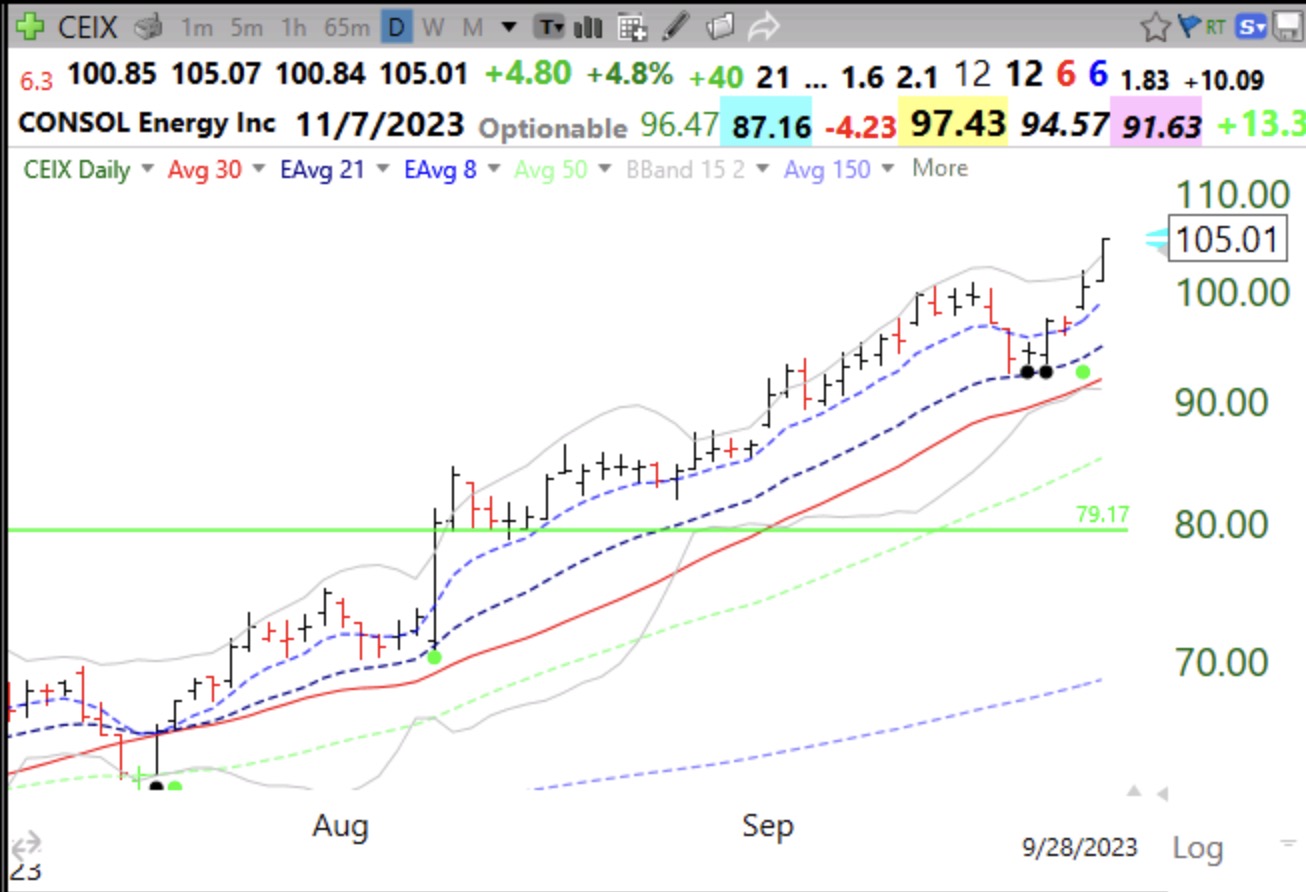
This daily chart shows that CEIX never closed below its green line after its GLB. Note the second possible entry at the black dots, designating oversold bounces.
Looks like QQQ may kiss the underside of the red line and then resume the downside. Be careful what you buy since another plunge may take everything with it. https://schrts.co/AwpBduiC
Financial sector still has room to drop before breadth market buy signal triggers. https://schrts.co/FmgmYeUk
Also keep in mind that SP500 stocks above 50dMA undercut 10% yesterday. Historically seems to be a time to buy some SPY.