This chart is updated daily and posted to the bottom of this blog. Buying stocks that consolidate and then break out to all-time highs can work!
Stock Market Technical Indicators & Analysis
This chart is updated daily and posted to the bottom of this blog. Buying stocks that consolidate and then break out to all-time highs can work!
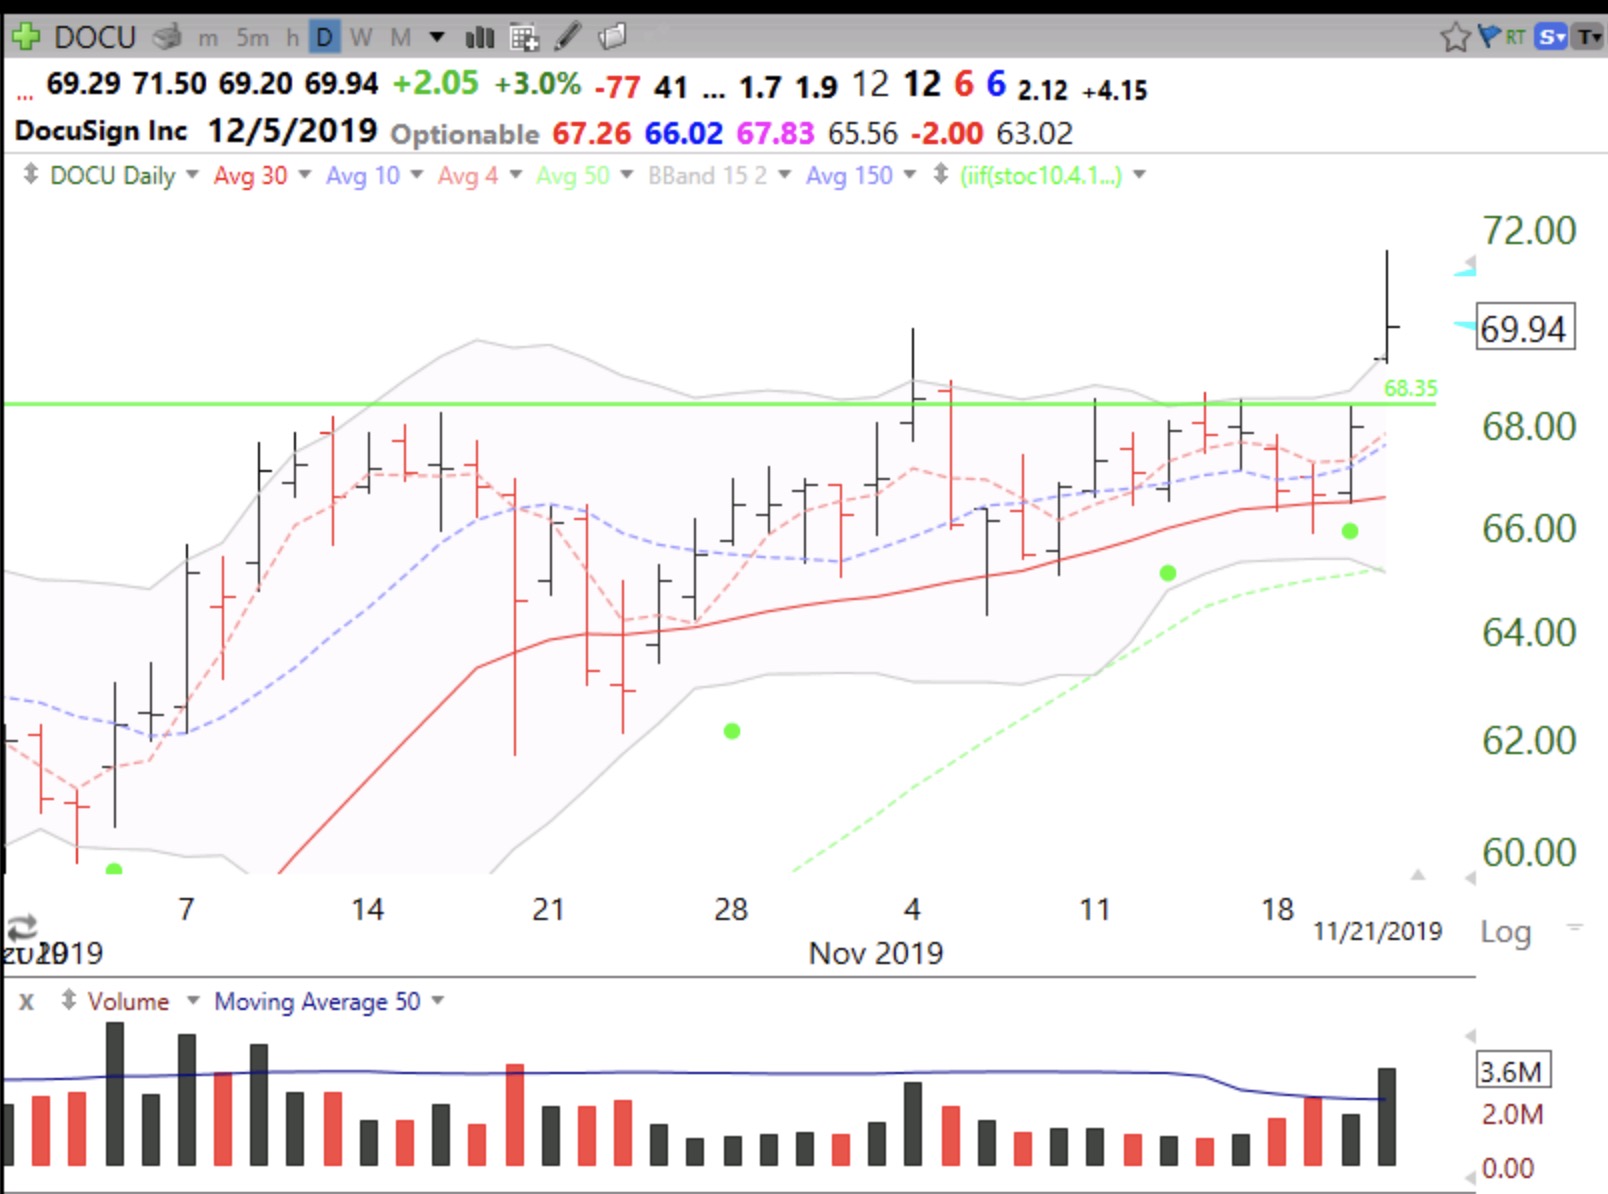
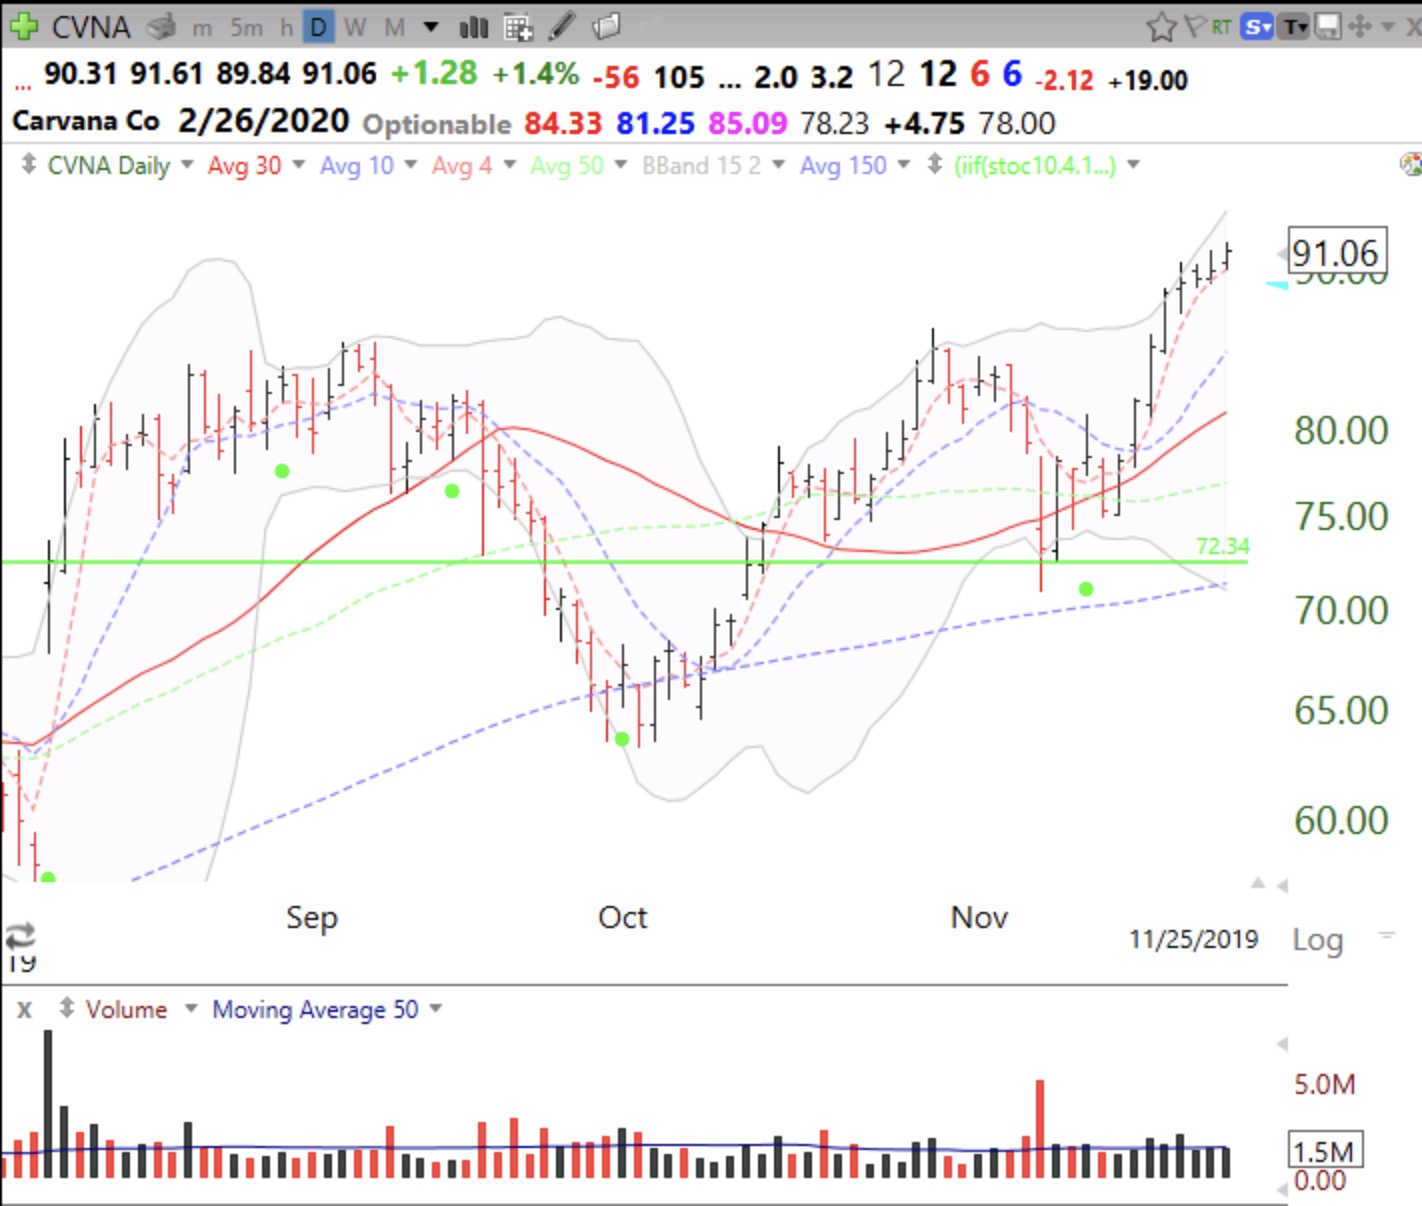
I looked at all new highs from Monday and sorted them in TC2000 by how much they are up from a year ago. $CVNA caught my eye. It retested its GLB and is now trading 3.2 times its price of a year ago. Note the green dot signal after the retest. Nicolas Darvas pointed out that stocks that have doubled are likely to double again. Below is daily chart.
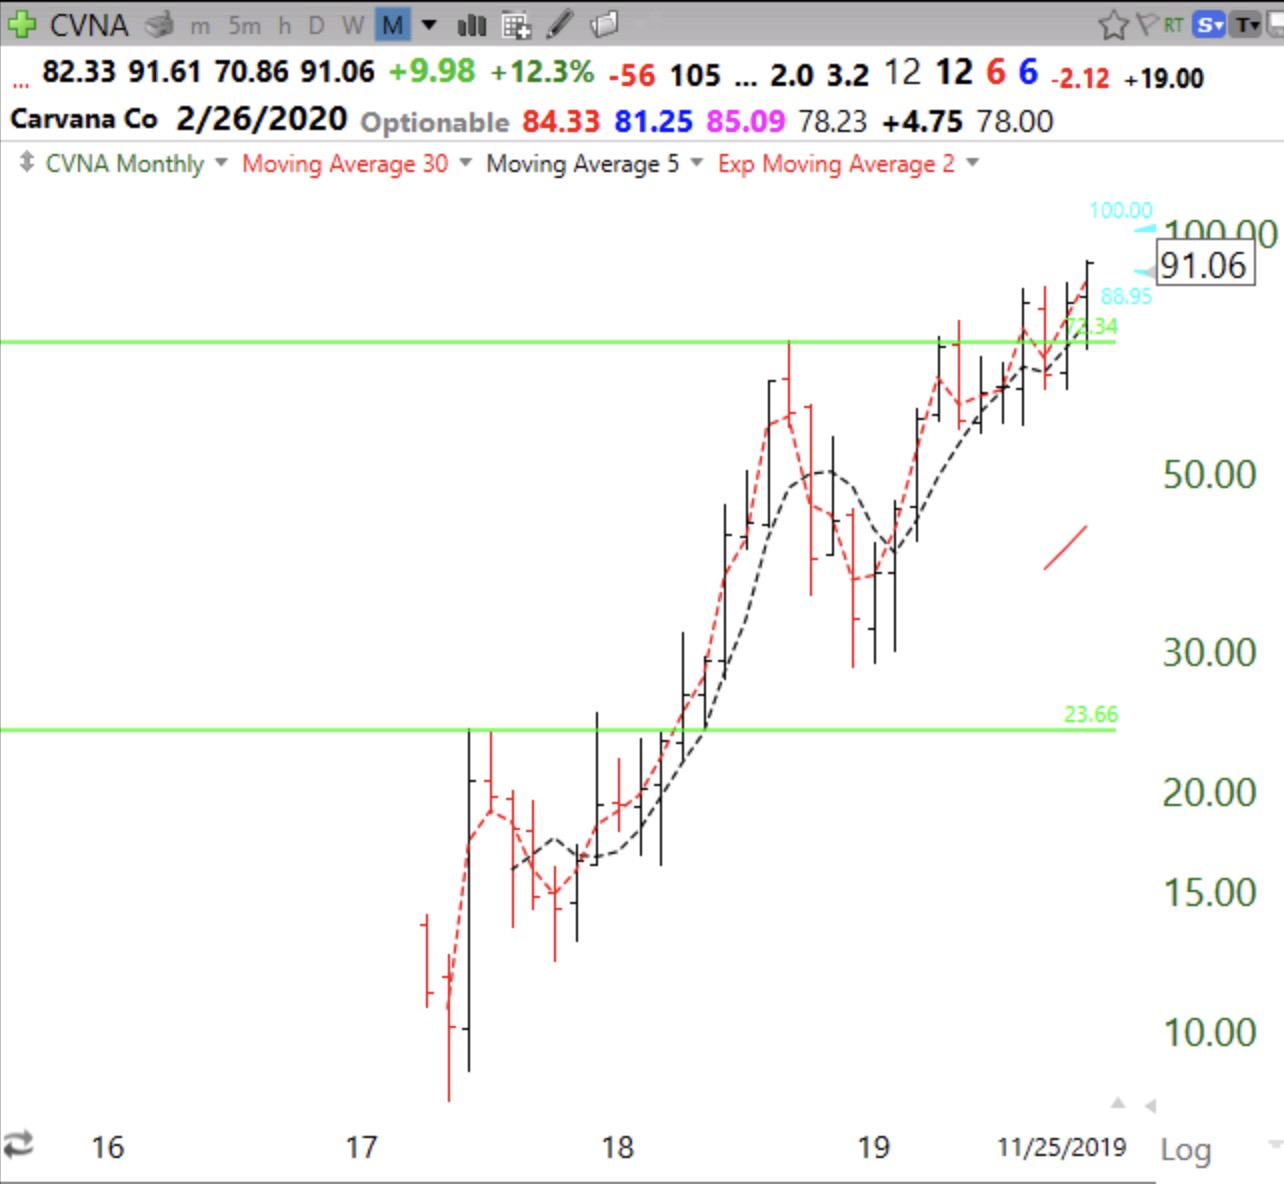
The monthly chart shows that CVNA is almost a 10 bagger since its IPO in 2017. Note its first GLB in early 2018.
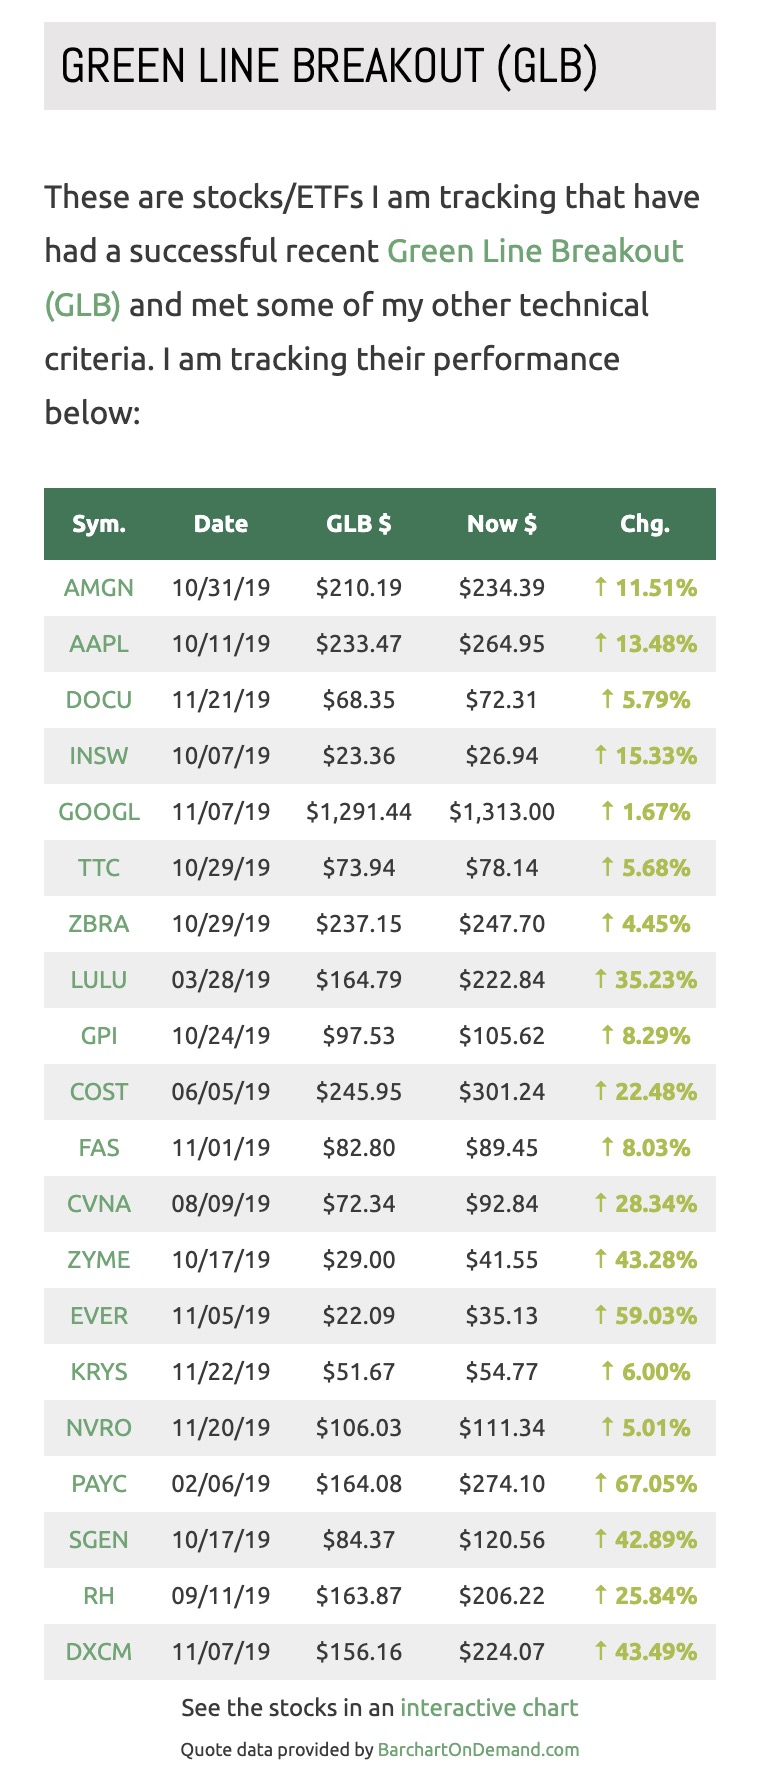
I have restarted the GLB table, check it out on this blog daily.