I have been posting for a while that the tech stocks were weak, as reflected in the QQQ, even as the large cap stocks in the SPY and DIA remained strong. My short term trend count on the QQQ reached the 10th day of its down-trend on Friday. I noted in my Thursday night post that it remained to be seen whether the tech stocks or the others would take the lead for the market. It now appears that the weak tech stocks were forecasting overall market weakness. My trading gurus have written that when the market leaders fail, the rest of the stocks eventually falter. If the exciting growth stocks cannot climb higher, one should not expect the slower growing stocks to push higher. I know there are times when value stocks outperform growth stocks. But I think this typically occurs after a bear market when people tiptoe into the conservative stocks first. As people have profits and gain confidence in the market , they switch into the riskier growth stocks. But that is likely over now for this cycle. Abandonment of the growth stocks probably reflects greater fear of overly high prices and a coming market decline. And given that we are approaching the “Sell in May and Go Away” period, some people may have hit the exits early. Everyone wants to get out first……
Readers have asked me how I could have a GMI Buy signal in place during a QQQ short term down-trend. The two are not mutually exclusive. The GMI counts short and longer term indicators. While it is rare, it is possible for 4 or more GMI components to be positive (required for a buy) while a short term component is negative. I use my QQQ short term indicator to time my positions in my speculative trading accounts. I have been largely in cash or short in those accounts since the QQQ short term down-trend began about 10 days ago. But I also use the GMI to provide further context for my trading decisions. I currently remain invested in mutual funds in my university pension where my trades are limited. The GMI is typically “0” for a while before I exit those mutual funds and go into money market funds. I hope this explanation helps…..
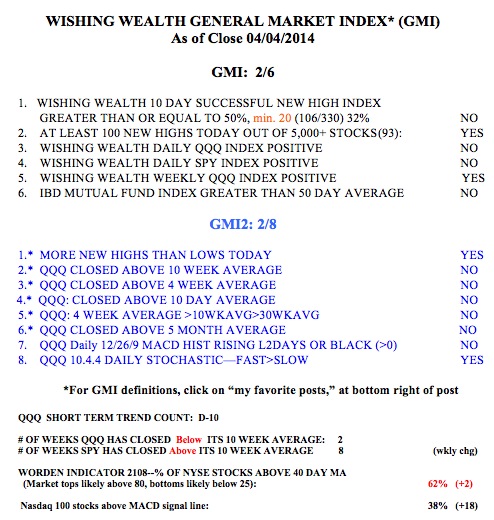
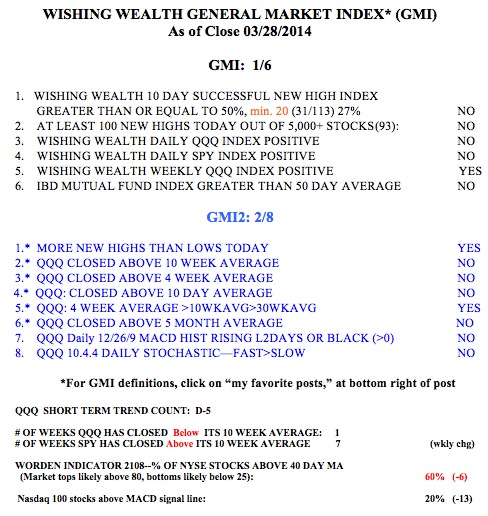
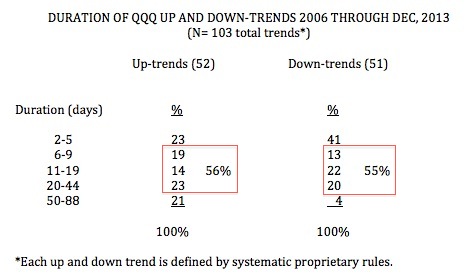
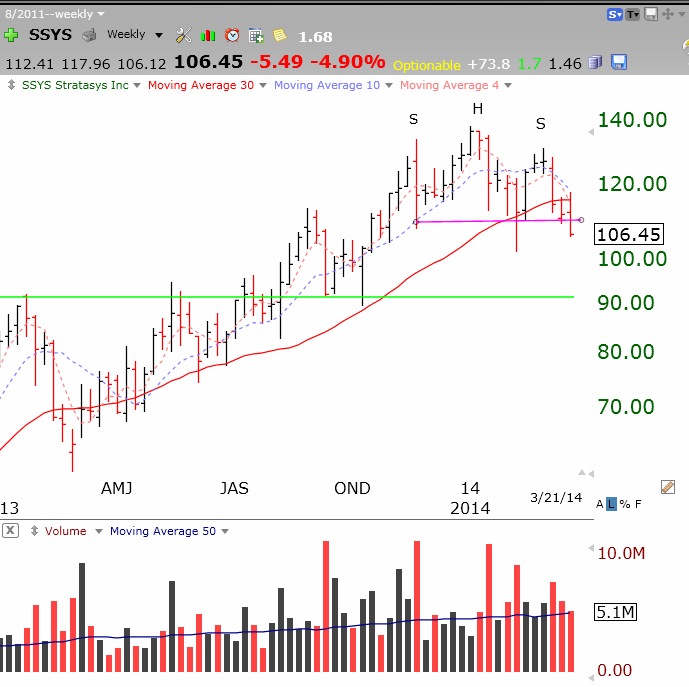
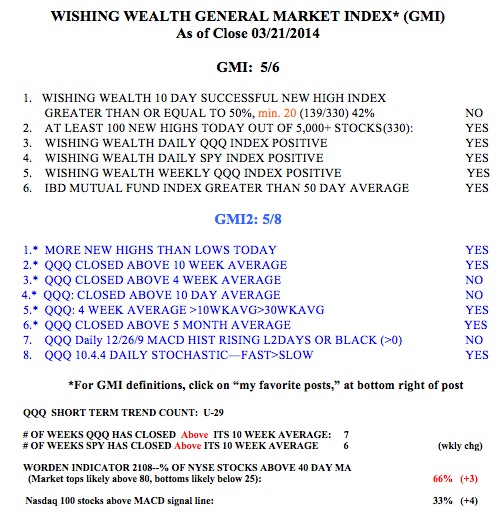
After only a few days, IBD has now gone back to calling the market in a correction. I think it was a mistake for them to go to an up-trend in the absence of a high volume follow-through day. (I noted this concern when they first made their call.) The GMI table below shows the divergence in this market. The QQQ has now closed below its 10 week average for two weeks even as the SPY has closed above its 10 week average for 8 weeks. I have written repeatedly that I cannot make money being long tech stocks when the QQQ is below its 10 week average. Meanwhile, the QQQ short term down-trend count is D-10 (10th day). By my calculation, about one half of the QQQ short term down-trends since 2006 that reached day 10 lasted for more than 20 days. And with the Worden T2108 indicator at 62%, the market is far above the level (10-20%) where major prior bottoms have occurred. If the market closes Monday with the GMI below 3, it will trigger a new GMI Sell signal. This is too volatile a market for me to trade.