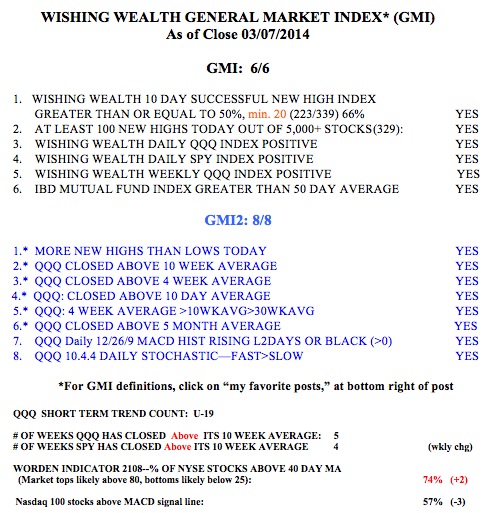
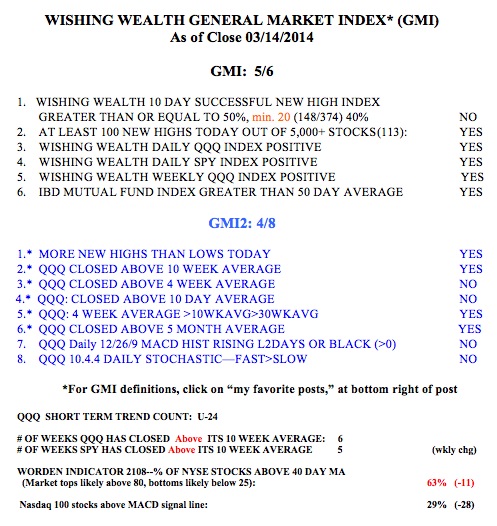
With the GMI at 5 (of 6), the longer term up-trend remains intact. IBD sees the market uptrend under pressure and notes that the put/call ratio on Friday was approaching 1.0, a sign that a bounce may be coming as bearishness grows. I am largely in cash in my trading accounts, having had my positions in GLD and NUGT called away at Friday’s close. We are in the post-earnings release period when the market often corrects. As we get close to the end of the month and the end of the first quarter, the market will likely recover as it starts to anticipate new earnings reports. I am waiting to enter positions in rocket stocks when they bounce from oversold levels. I am also continuing to write some weekly call options. Here is the weekly GMI table:
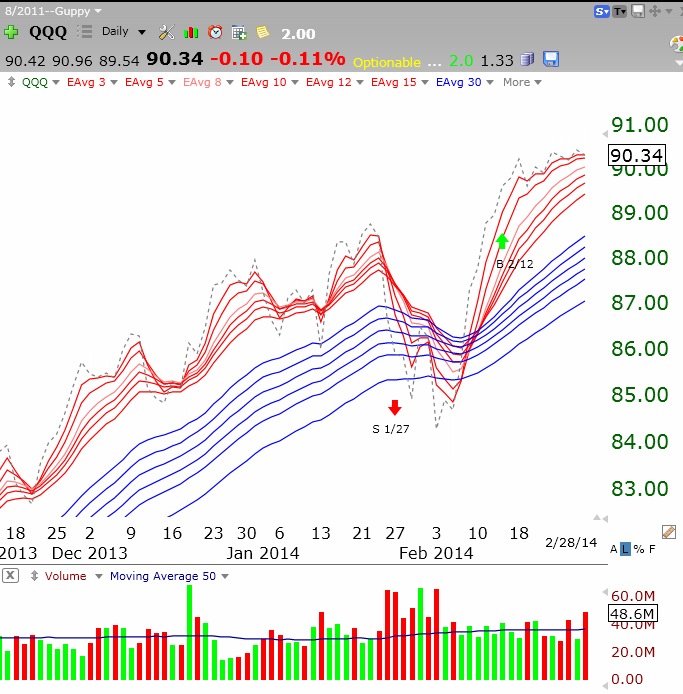
 A weak close on Monday would turn my QQQ short term count (U-24) into a new down-trend.