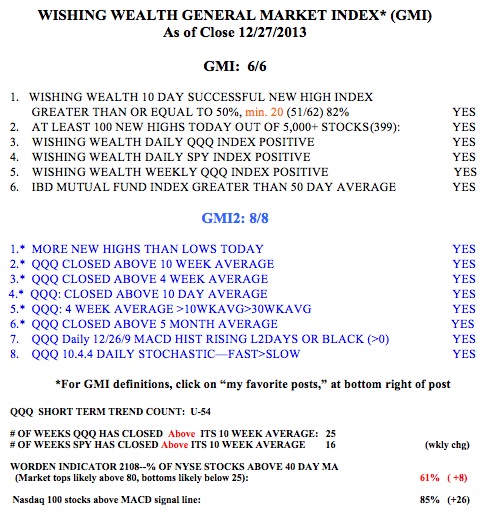
I told you that I have successfully traded AAPL by holding it when it closes above its 10 week average and exiting when it closes below. AAPL has now closed below its 10 week average (blue dotted line) and I have exited the stock. This weekly chart of AAPL also shows that AAPL remains in a Stage 2 up-trend (above its rising 30 week average, red line) with support around 493. But do I want to hold it if it falls to there?
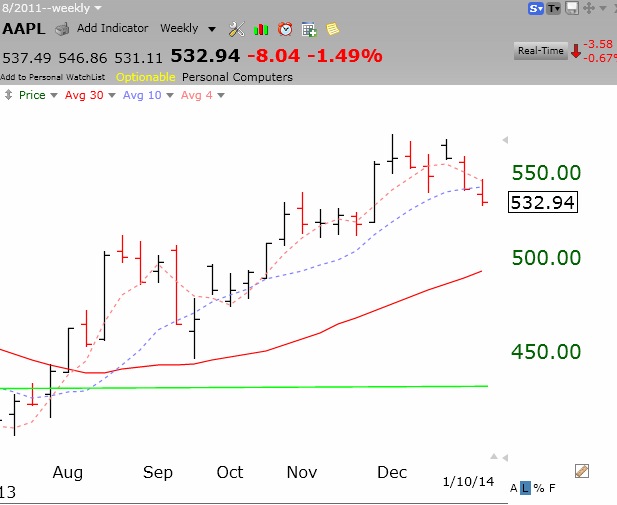
Another way to look at it is through the Guppy GMMA chart. Note that AAPL has now closed below 5 of its 6 shorter moving averages (red lines). The dotted line is the closing price each week. This indicates considerable weakening of its up-trend.
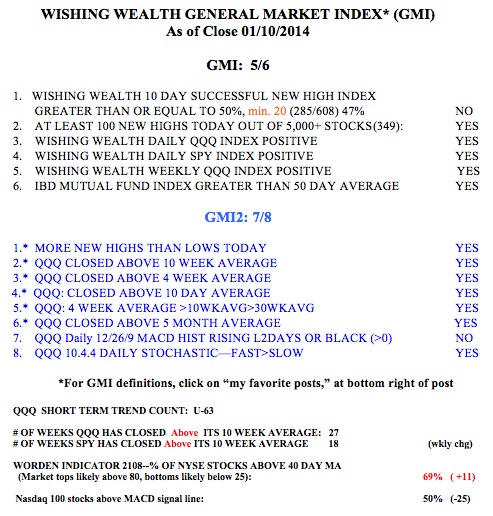
With AAPL being a heavily weighted ingredient in the QQQ showing weakness, this index may also have trouble continuing its up-trend. Furthermore, the up-trend is 63 days old, rather long for a short term up-trend. With more than 60% of advisers in the Investor’s Intelligence most recent poll reporting that they are bullish, I suspect this is not the time to be hanging on to a lot of positions in tech and growth stocks. I am ready to exit quickly if the GMI and GMI-2 weaken.