On my trip to Amsterdam, I monitored the market when I coud. There were no major changes in my indicators. Some of my put options resulted in my positions (TSLA, IRBT) being sold (option assigned) over the weekend, however. Puts are great insurance for times when I cannot monitor my positions. During the 8 hour plane trip back I studied Mark Minervini’s new book, posted to the lower right of this page. It is the best new book on buying super performing growth stocks than I have seen in a long time. Of most importance, the author has made a fortune trading. I found his insights extremely useful and harmonious with my own trading strategy. He also likes buying stocks that are trading at all-time highs. His analysis of the technical patterns of growth stocks that are breaking out is superb…..
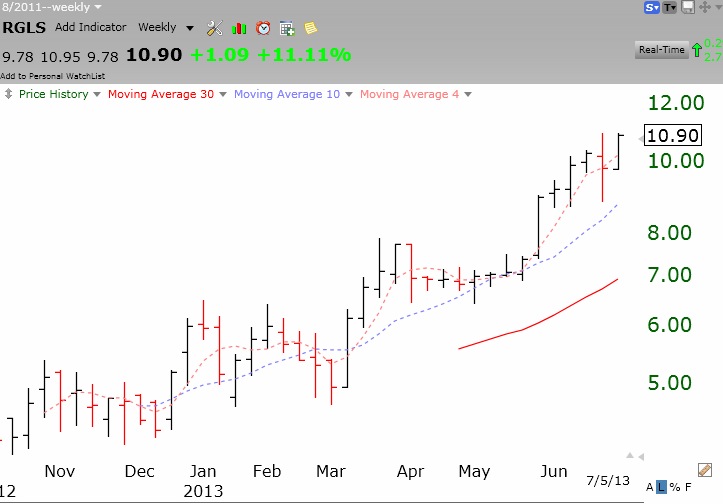
While I was away, ONVO really started to move. I told you months ago about this bio-printing (3D) stock. Now that this 3D printing company is listed on the NYSE MKT, it can be bought by institutions. I told you that this “Judy’s Pick” was very high risk and like a lottery ticket. Thus far, however, the stock has more than doubled. After last week’s action, I would expect some type of consolidation, in preparation for a possible assault on its all-time high of $10.90. ONVO is still very much a lottery ticket, as it has yet to make a profit. However, if it can break above its green line top of 10.90, I would become very interested. Recent IPO’s that break a green line top often become big winners……..
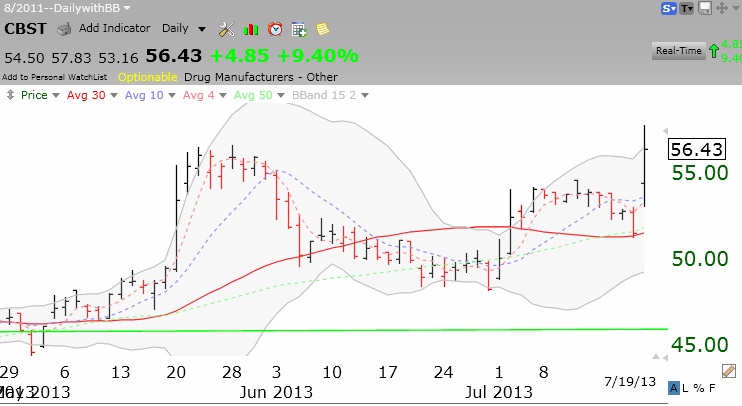
In running my new high scan, I found CBST. It looks to me like it had a cup and handle break out to an all-time high on Friday on above average volume. It might be worth a close look, if it can hold above the break-out pivot price, around $54.70. See the daily chart below (click on to enlarge). CBST may be trading higher based on its pipeline of new drugs. Note that it is a recent green line break out stock, indicating that it is trading near its all-time high.
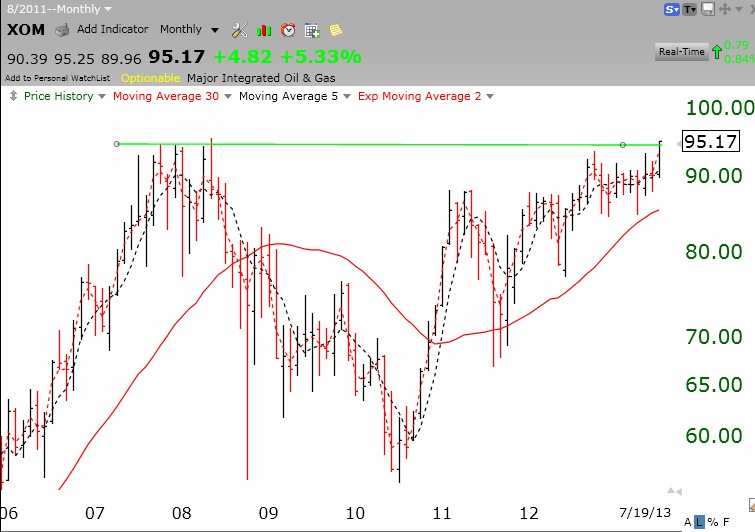
Speaking of green line break-outs, has anyone noticed that XOM is about to break its all-time high? (CVX is also strong.) Does anyone care that oil is surging higher? Check out this monthly chart of XOM. What will higher oil prices do to the economy, and the market?
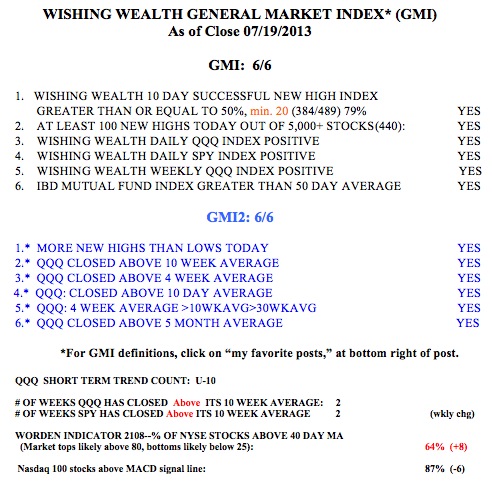
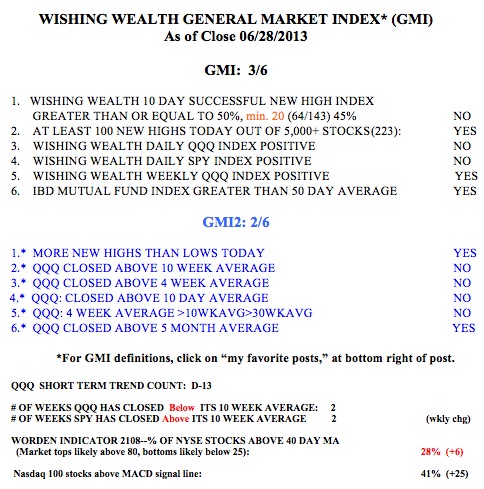
The GMI remains on a Buy signal with all indicators positive. The QQQ and SPY just completed their second week above their critical 10 week moving averages. The Worden T2108 Indicator, at 64%, remains in neutral territory. It’s nice to be back!