Window dressing this week? Approaching “sell in May and go away”; Judy’s picks: MAKO and INVN

GMI6/6
GMI-26/9
T210854%

We may get the last minute “window shopping” by mutual funds this week, as they   purchase recent stock winners like AAPL to enhance their portfolios. Then we wait for first quarter earnings…….

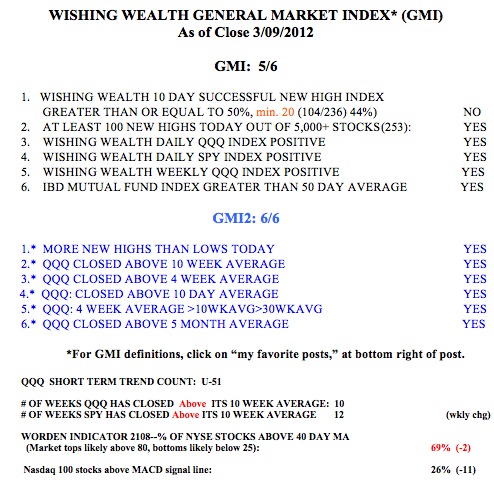
Meanwhile, the GMI buy signal from 12/23   remains in place. All of my indicators are positive.   Friday was the 61st day of the current QQQ short term up-trend.   Prior up-trends rarely go past 80 days.   The top could appropriately happen around late April, when we reach the, “Sell in May,” period. So, I will watch the charts very closely for any sign of a meaningful top in late April.   The Worden T2108 Indicator remains in neutral territory, at 54%.   50% of the Nasdaq 100 stocks closed Friday with their MACD above their signal lines, an indicator sensitive to short term strength. The SPY has closed above its 10 week average for 12 straight weeks.

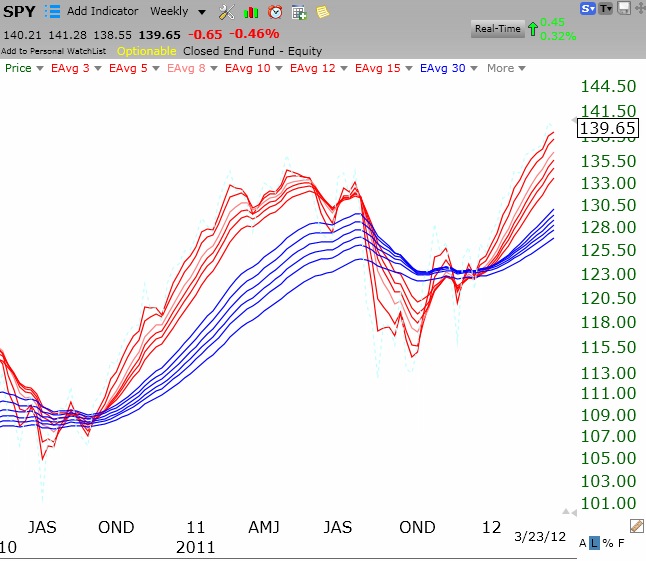
The weekly   GUPPY chart of the SPY shows this index to be in a strong accelerating up-trend.   It shows no signs of any top, with the short averages (red) rising well above the longer term averages in a RWB rocket pattern. Weakness will show up first in a decline of the red averages.

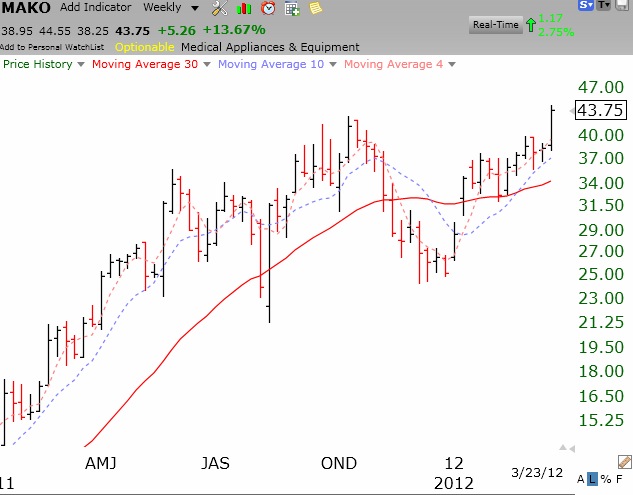
One of Judy’s picks from a long time ago showed considerable strength on Friday.   As this weekly chart of MAKO shows, it broke out of a base to a new high on increased volume last week. Judy selects stocks first by their concept and bought MAKO around $7.   MAKO is a leader in the field of robotic surgery. Many boomers are going to need knee and hip repair……

Judy’s other   pick, INVN, also broke to an all-time high on Friday.

GMI out-performs in new study; GLD starting Stage 4 decline?

GMI5/6
GMI-26/9
T210869%

Since the GMI buy signal on 12/23, the QQQ has advanced 15.9%, and the double long QQQ leveraged ETF, QLD, has advanced +33.9%.   I have repeatedly written that riding the leveraged long index ETF during a sustained up-trend is easier and more productive than looking for the rare stock that will outperform it.   For example, during the same period, AAPL has advanced 35.2%.   But riding a single stock is much more dangerous to me than riding an index that reflects a basket of stocks.

There is a site, dark-liquidity.com, that has now posted the GMI performance since January 1 by applying it to the QQQ and trading the QQQ or QLD.   Using the GMI to trade the QLD has greatly outperformed all other strategies on the chart. The strategy employed uses the same decision rules that my student and I backtested to 2006 with incredible success. I, of course, will post when the GMI gives a new sell signal. The GMI has done so well because the up-trend has been rising steadily since 12/23, and is now in its 51st day.   Leveraged ETFs, because of daily compounding of results, can be extremely dangerous when a decline sets in.   The success of the GMI strategy is based on the idea of going to cash when a sell signal occurs.   Riding a decline down could wipe out all of the gains and more……

The GMI is only at 5 (of 6) because the Successful New High Indicator is negative.   Stocks that hit a new high 10 days ago are just not likely (at least 50%) to be above where they closed 10 days ago.   This is an important indicator because I buy stocks at new highs and want to know that   stocks that achieved a new high are continuing to rise. The Worden T2108 Indicator closed at 69%, and is now in neutral territory.   When it was near 80% I wrote that that is where advances tend to end or stall.   Only 26% of the Nasdsaq 100 stocks have their MACD above its signal line, indicating little short term strength. Keep in mind, however,   that we are approaching the end of the March quarter when mutual funds will scoop up the strongest stocks, like AAPL.

The dollar(see ETF, UUP)   has turned and is now in a beginning Stage 2 up-trend.   This may be bad news for gold.   I am posting below the weekly chart of the gold ETF, GLD.   I have placed red arrows by a number of technical signs of weakness.   Among them are, a close below the critical 30 week average, which itself is starting to decline; big red volume spikes on down weeks; and a weekly stochastics indicator   that is heading down. For those of you in my class who wanted to see   Fibonacci numbers at work, note the weekly chart below.   (Click on chart to enlarge.) The recent rise from near 148 to 174 is near a 62% retracement of the decline from September through December. A failure to close above 167 could signal a significant decline in GLD. This might also be consistent with William O’Neil’s suggestion that one short leaders 4-6 months after the peak price was reached.

GMI at 5 and T2108 falls to 71%

GMI5/6
GMI-26/9
T210871%

The market has weakened just a little.   This week we will see if AAPL will fall after its product news is released.   If it does, we might get that several week post earnings release lull until the end of March when mutual funds will engage in window dressing of their portfolios so they will look good to investors.   We might then see a rise as first quarter earnings are released in early April.   I am hoping this scenario comes true. Meanwhile the GMI dropped one, to 5 but the buy signal of 12/23 remains intact. Friday was the 46th day of the current QQQ short term up-trend. The T2108 is finally moving out of over-bought territory, but is still far above the level where a new up-trend in that indicator typically begins. With these mixed signals, I am inclined to wait a few days to see if this market rally holds up.