Blog post: $QQQ short term up-trend holds, has now reached 7 days; the GMI remains Green; I hope to see you at this weekend’s free TraderLion first annual trader conference

GMI6/6
GMI-25/9
T210857%

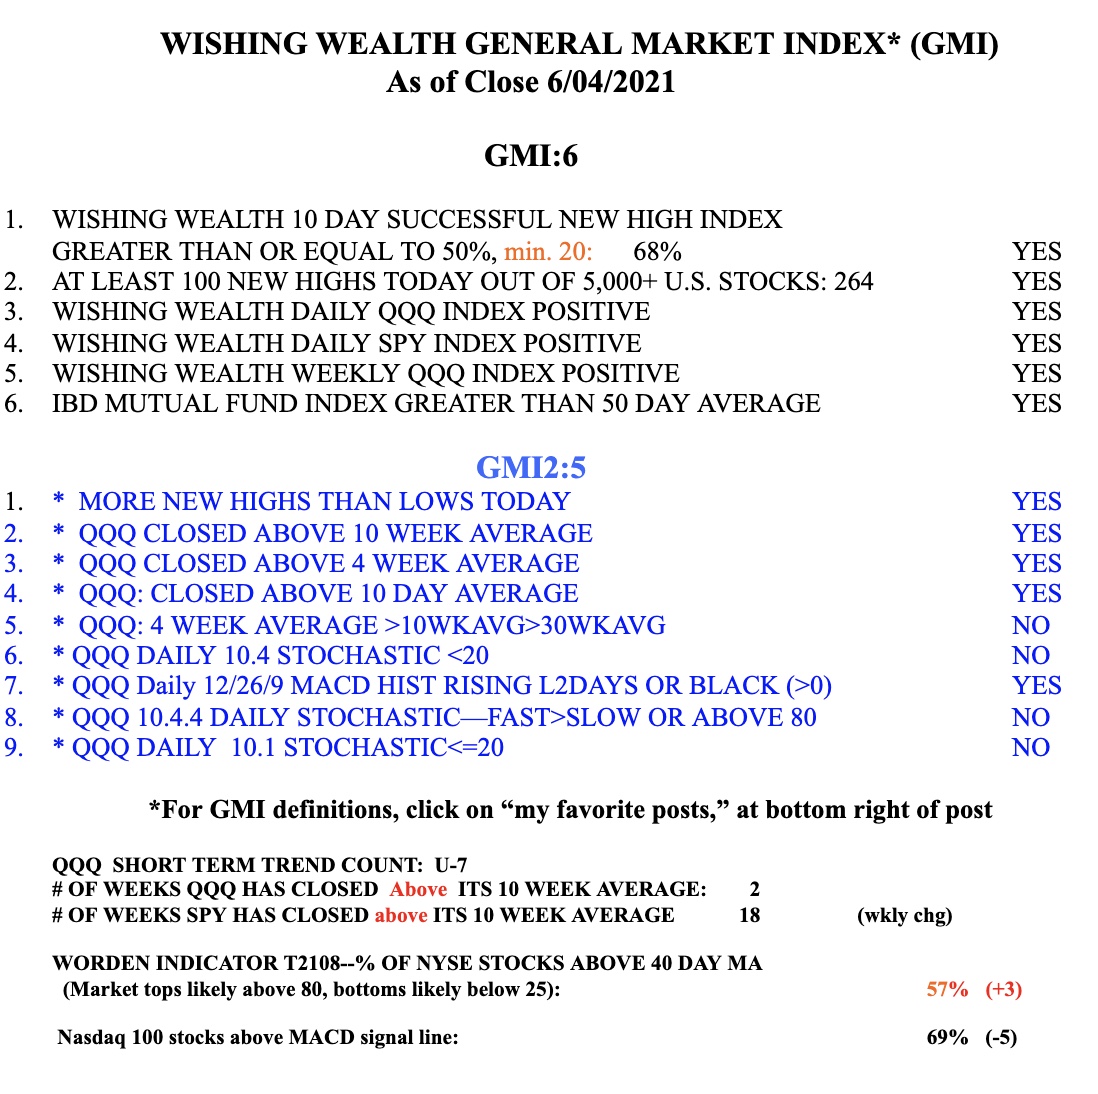
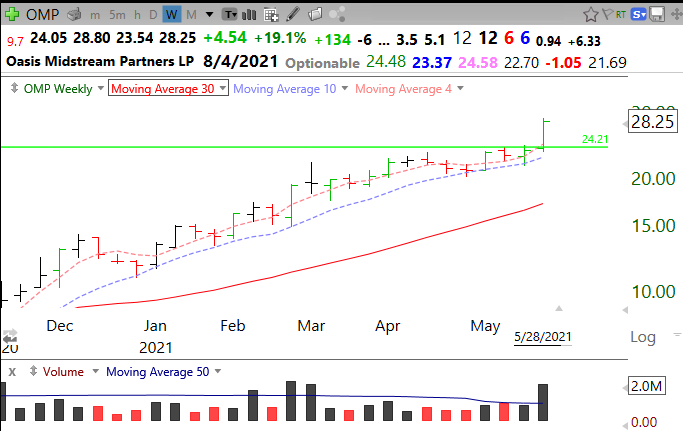
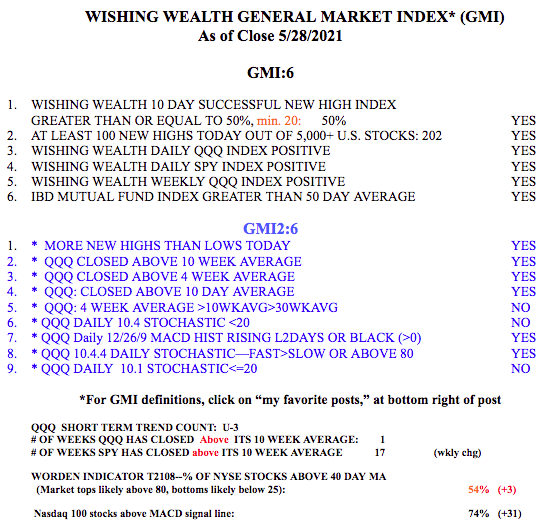
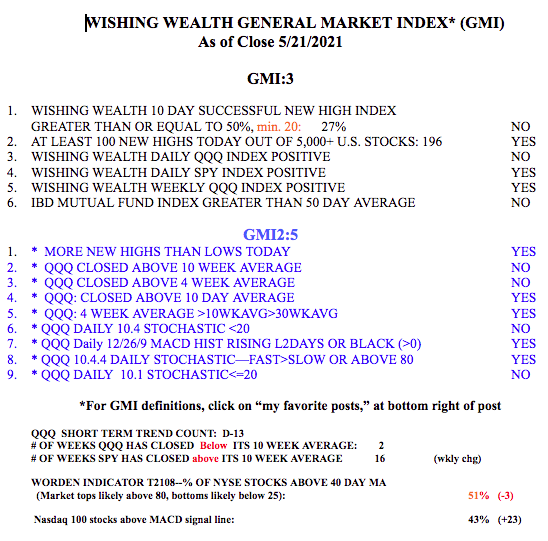
QQQ held on the edge of the cliff on Friday and the QQQ short term up-trend survived. Thus far, the Sell in May and go away theme has been more right than wrong. I was amazed to run a scan over the weekend for launched rocket stocks and to find only 1% ($GOOGL) among the Nasdaq 100 (the QQQ ETF) stocks, but 7% among the S&P500 stocks and 11% in my watchlist of 730 stocks that have been highlighted in the past on lists of promising stocks on investors.com or on the MarketSmith Growth 250 lists. This analysis showed me clearly that the QQQ type tech stocks have not been the place to find winning stocks. So this is why so many traders have opined on social media that this has been a very difficult “hard penny market” of late. Note that in the GMI table below I show that SPY has closed above its critical 10 week average for 18 straight weeks, compared with only the last 2 for the QQQ.

My extraordinary student, Richard Moglen, was introduced to technical analysis during my university honors course for undergraduates and has become passionate about stock trading and educating others. Richard’s youtube tutorials and interviews with accomplished traders are an invaluable educational resource and he has recently joined theTraderLion team.  Richard will introduce me this Saturday to present at  the TraderLion’s  first annual trading conference. Experienced Portfolio Managers, Hedge Fund Managers, US Investing Champions, and Veteran Traders will share their insights at this live event. This free 2-day event will be streamed live on TraderLion’s YouTube channel youtube.com/traderlion on Saturday, June 12th and Sunday, June 13th. The presentation topics will range from entry setups to risk management and trading psychology. To stay in the loop visit https://www.traderlion.com/annual-trading-conference/

TraderLion is dedicated to educating people about trading and I will be pleased to present some of the set-ups and concepts I have developed based on my experience with the trading and investing the past 50+ years. I will speak at 2:30-3:45 and hope to see you there. Please go to the TraderLion site above for more information about the event…..

The GMI remains positive at 6 (of 6).

Blog post: GLB (green line break-out) explained; Some stocks having a GLB last week: $MEC $OMP $TGLS $FLNG $CUBI

GMI6/6
GMI-26/9
T210854%

One of the most important innovations I developed was the GLB or green line break-out. I like to buy stocks that have advanced to an all-time-high (ATH), consolidated for at least 3 months, and then break out to close at a new ATH. I use TC2000 to draw in the green line on a monthly chart at an ATH and alert me the moment the stock trades above the line. A green line can only be drawn after 3 months (3 monthly bars) have passed since a peak price bar that has not been surpassed (see monthly chart below). I make an exception for recent IPOs when the green line may be drawn after consolidating a few weeks after reaching a peak ATH.

Last December, I posted a weekly chart showing that PGNY had had a GLB at 36.50 and a weekly green bar (WGB). PGNY closed Friday at $64.04,  75% above its GLB.

Here is its monthly chart showing where the green line was drawn.


If I buy a stock after a GLB I sell it immediately  if it closes back below its green line. A failed set-up on which I base my purchase must always be sold. It is preferable for the GLB to occur on above average weekly trading volume. This weekend I identified a few stocks that have met the above criteria last week or a few weeks before. Here are their charts.

It is impossible to tell if any of these stocks’ GLB will fail or if it will rocket higher. I did look up their fundamentals on MarketSmith.  Their IBD Composite scores are MEC (78) OMP (94) TGLS (99) FLNG (98) CUBI (99). All have floats of <30 million shares.

The GMI is 6 (of 6), flashed a Green signal, and the new QQQ short term up-trend has now reached 3 days (U-3). I have begun to purchase TQQQ, the 3X leveraged bullish ETF for QQQ. If this up-trend persists I believe this is where I will likely make the most $$$$. Note that QQQ has now closed back above its 10 week average while SPY has closed above its 10 week average for 17 straight weeks.


Blog post: 13th day of $QQQ short term down-trend; Revised OSB (oversold bounce) scan yields $GS and $BGFV

GMI3/6
GMI-25/9
T210851%

I revised my OSB scan. It detects stocks near a recent ATH that have bounced from an over-sold level. Here are two I think are promising as long as the bounce lows hold. Note the black and green dot signals. Did you know that GS has a PE=8!!! And GS has an IBD comp rating=98.


The GMI remains on a Red signal. Even though SPY and DIA are doing well, QQQ is weak. This is a very difficult time to be in the market profitably. Much easier to trade growth stocks when the GMI is Green and consistently  registering 5 or 6.