I began seriously following the market around 1964. I remember at one investors meeting I attended, people were complaining about the decline in 1962 after what some called the Kennedy Slide. In 1966, 1970, and 1974, I witnessed other declines, especially the large one in 1974 while I was in graduate school. People back then talked to me about the coming new depression. Bear markets lasted for many months. There were also many years when the Dow was flat. Between 1965 and 1982, the Dow failed repeatedly to break 1000. Once it did, it marched on to reach 10,000 in 1999. That was the roaring 90s. It then hit a top, not broken for 6 years and then went on to the dreaded 2007 top and ensuing decline. Check out a chart of the Dow , (not inflation adjusted) and you can see multiyear periods when the market went nowhere. These long periods of a flat market typically came after a period when the indexes hit all-time highs for many years, just like the present! We may have been spoiled and misled by an ever rising market.
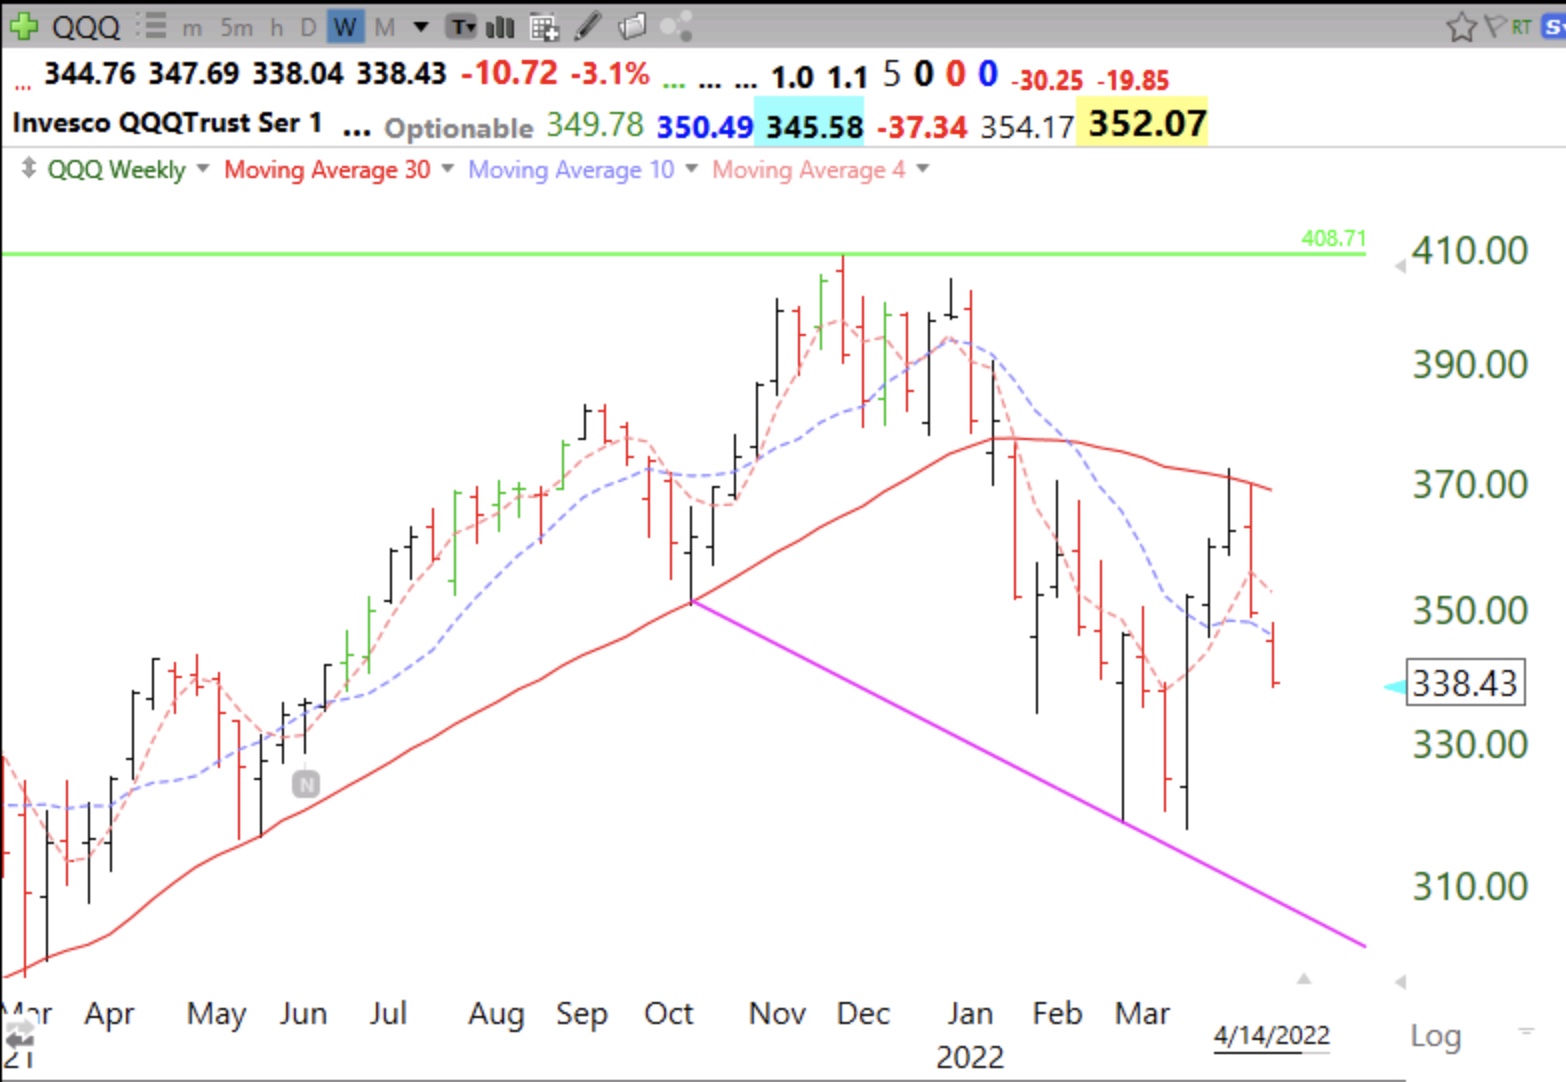
No one knows when the current decline will end. I can tell you that the SPY, DIA and QQQ have each formed a green line top, having not surpassed their monthly peaks for at least three mounts. The last green line break-out to ATHs (GLB) occurred for the DIA and SPY in November 2020, and in June 2020 for the QQQ. We will be back to a roaring trader’s market again when these indexes have another GLB to all-time highs, but it could be months or even years before that.
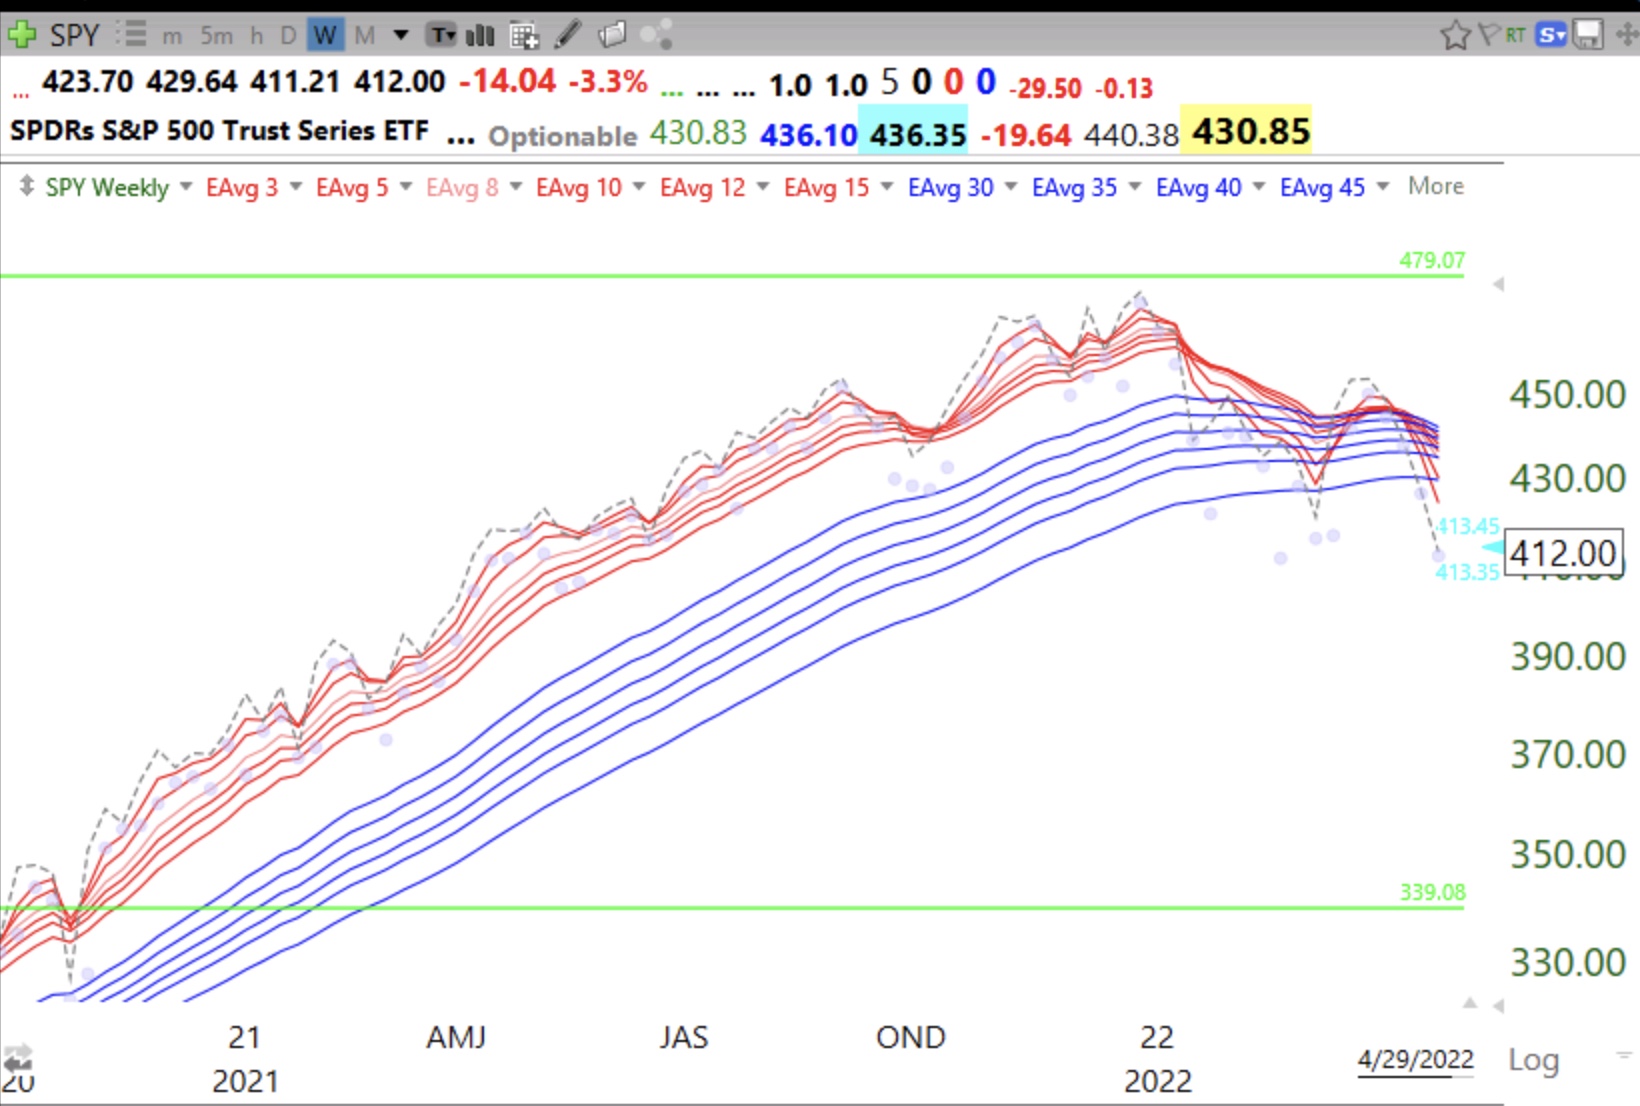
When I look back at my indicators from prior major market declines I conclude that the current decline may be just beginning. Compare the adjusted weekly GMMA chart for SPY in 2008 to that of the current decline. We are just beginning a weekly BWR pattern! This is a pattern where the shorter averages (red lines) are declining below the falling longer averages (blue lines) with a white space separating them.
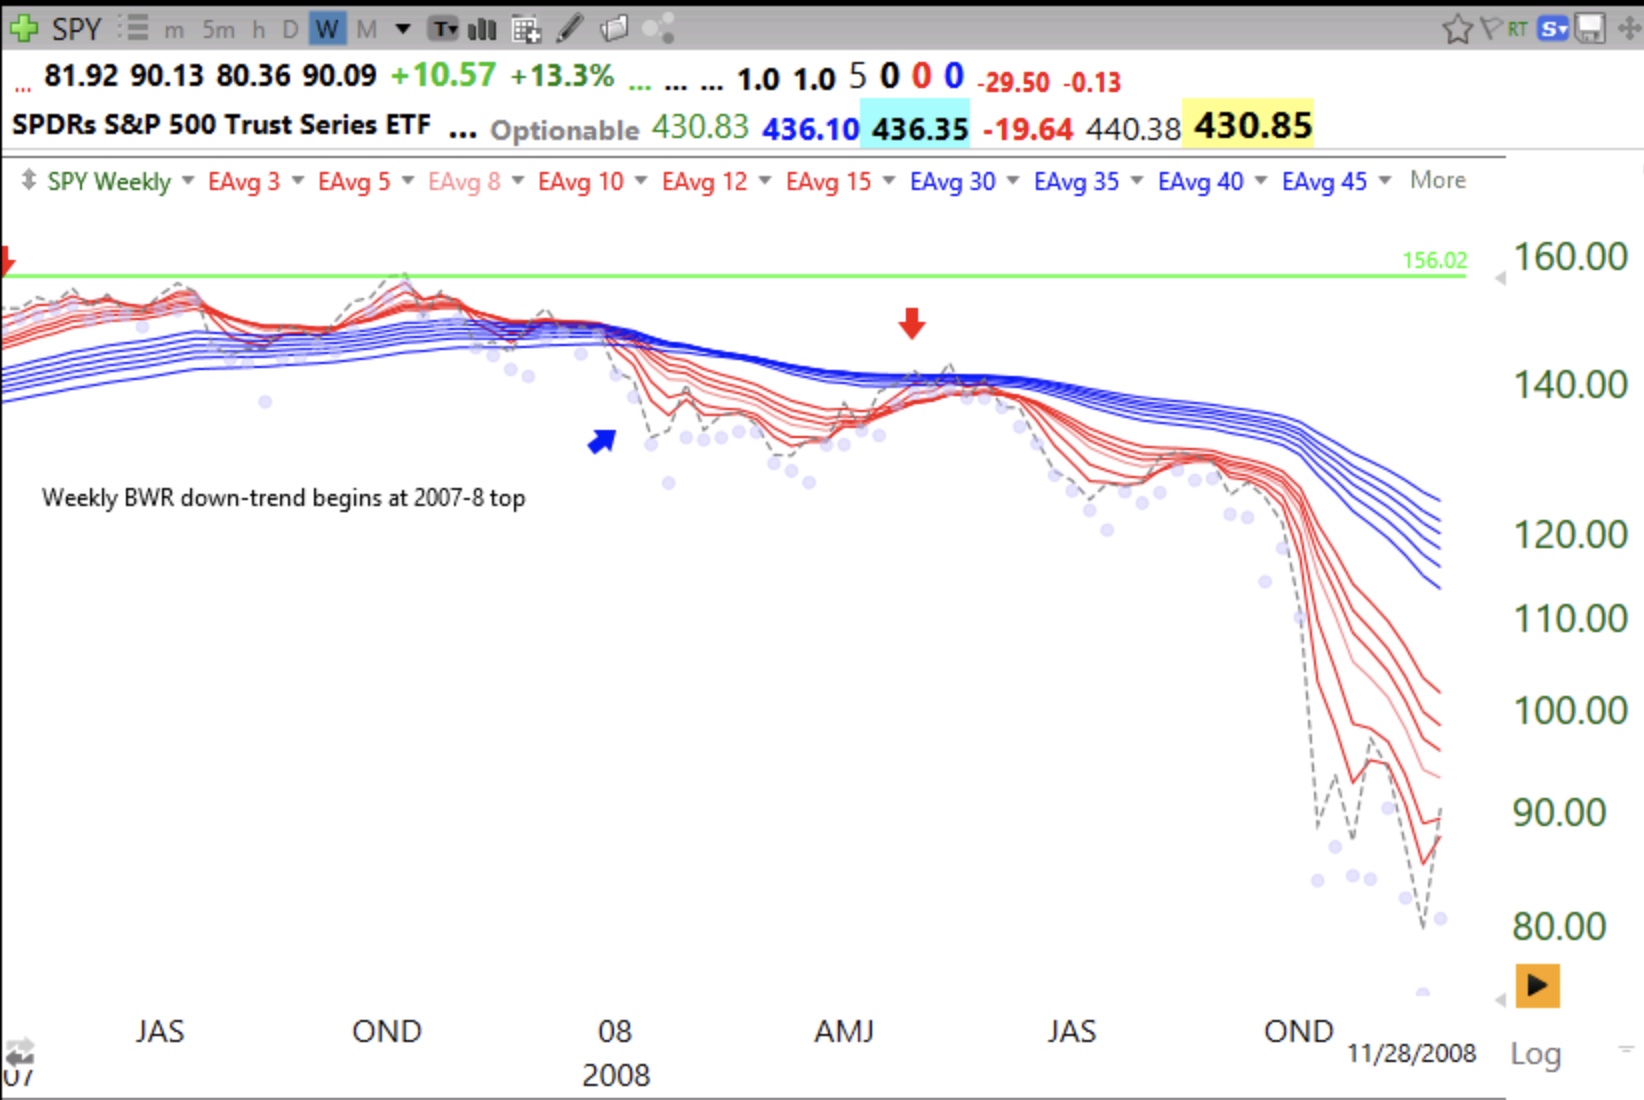
SPY is not even in a full weekly BWR decline!
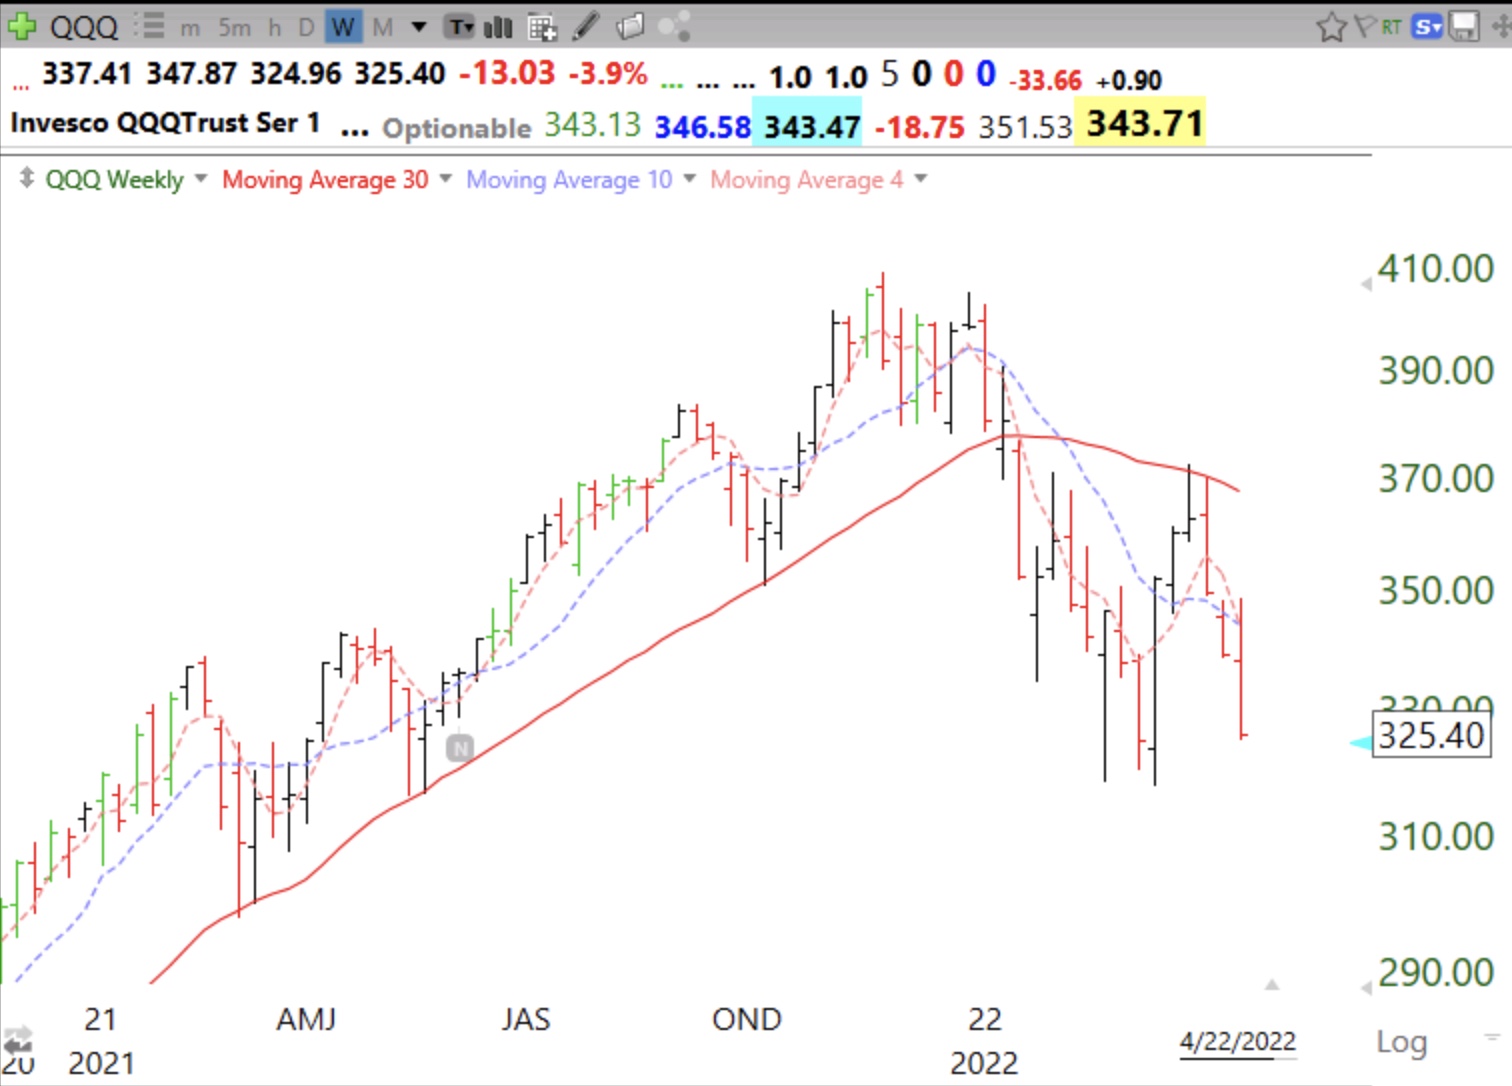
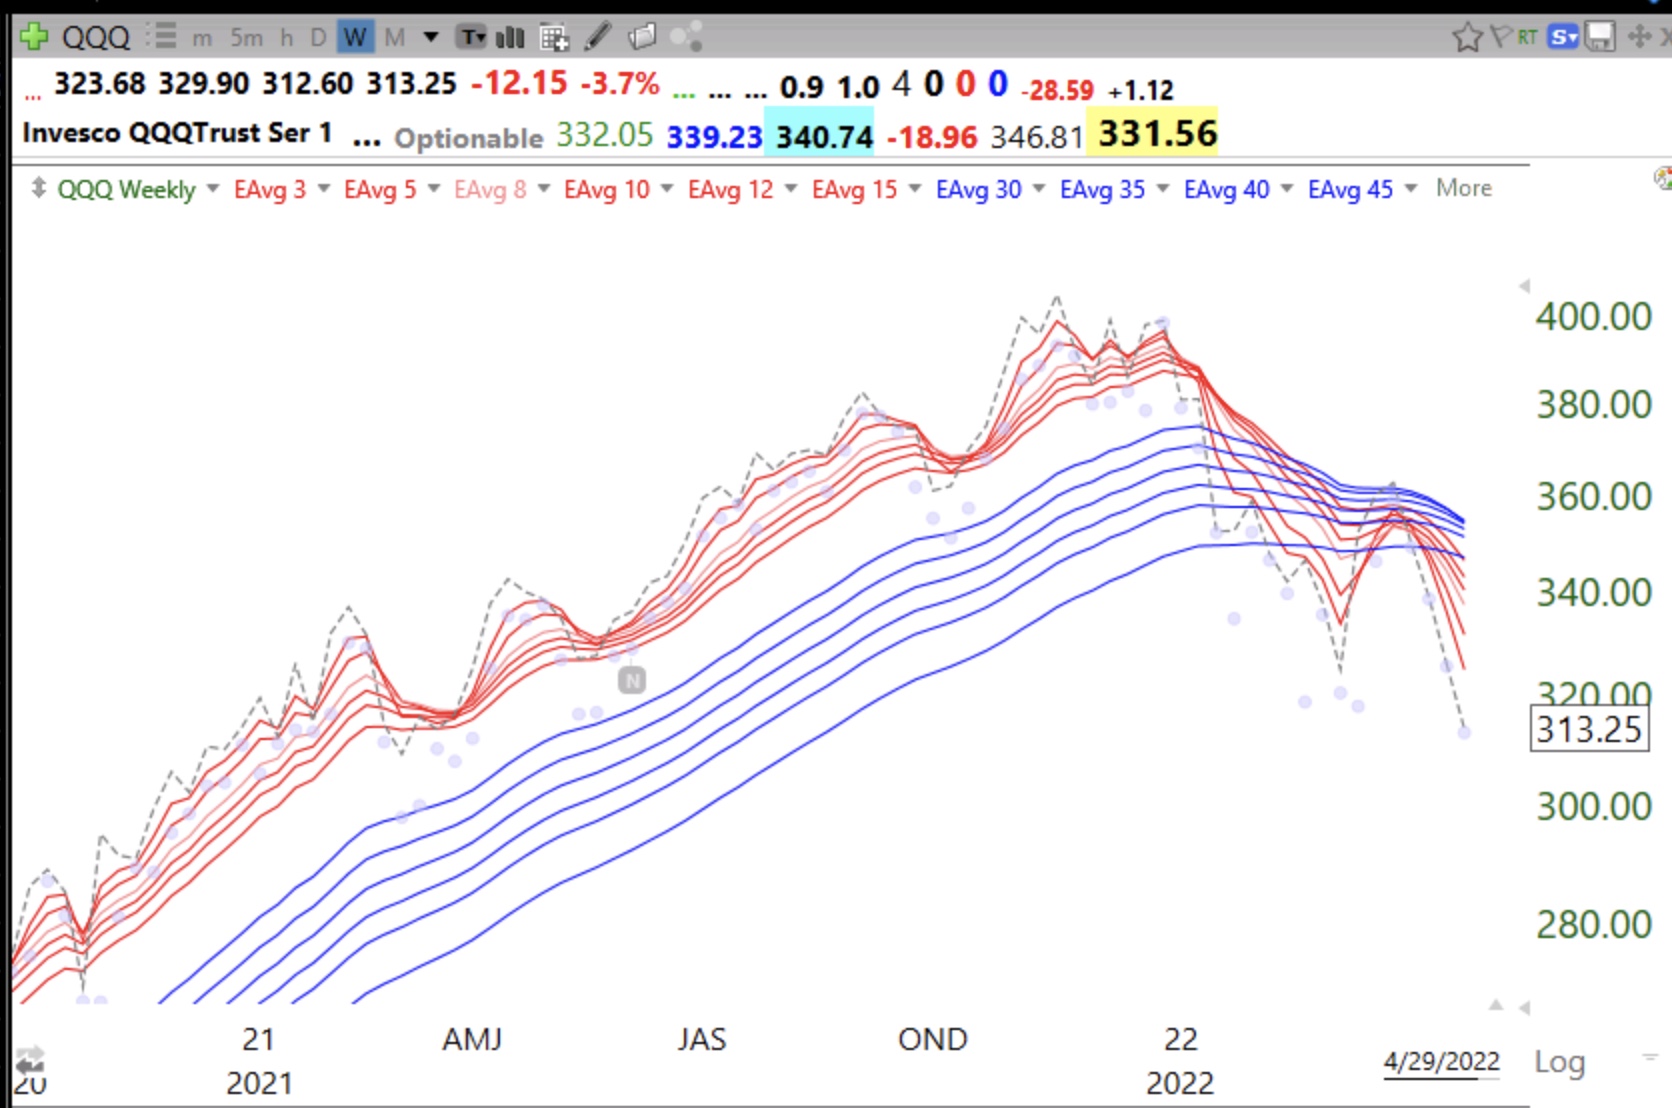
I could have shown other indexes or periods but they would have revealed similar patterns. Here is QQQ, just forming a weekly BWR pattern. Note the nice weekly RWB up-trend all of 2021. That is when trading was very profitable for many.
We have yet to see the panic that typically occurs near a market bottom. Many people now painfully realize that the market does not always rise but I think it unlikely that many people have sold yet. They are willing to buy and hope. When they give up on the market after it has declined much further and they never want to engage with it again we will probably have a bottom. As they say, the time to buy is when everyone is afraid to….(I modified the traditional quote in respect for the carnage in Ukraine)
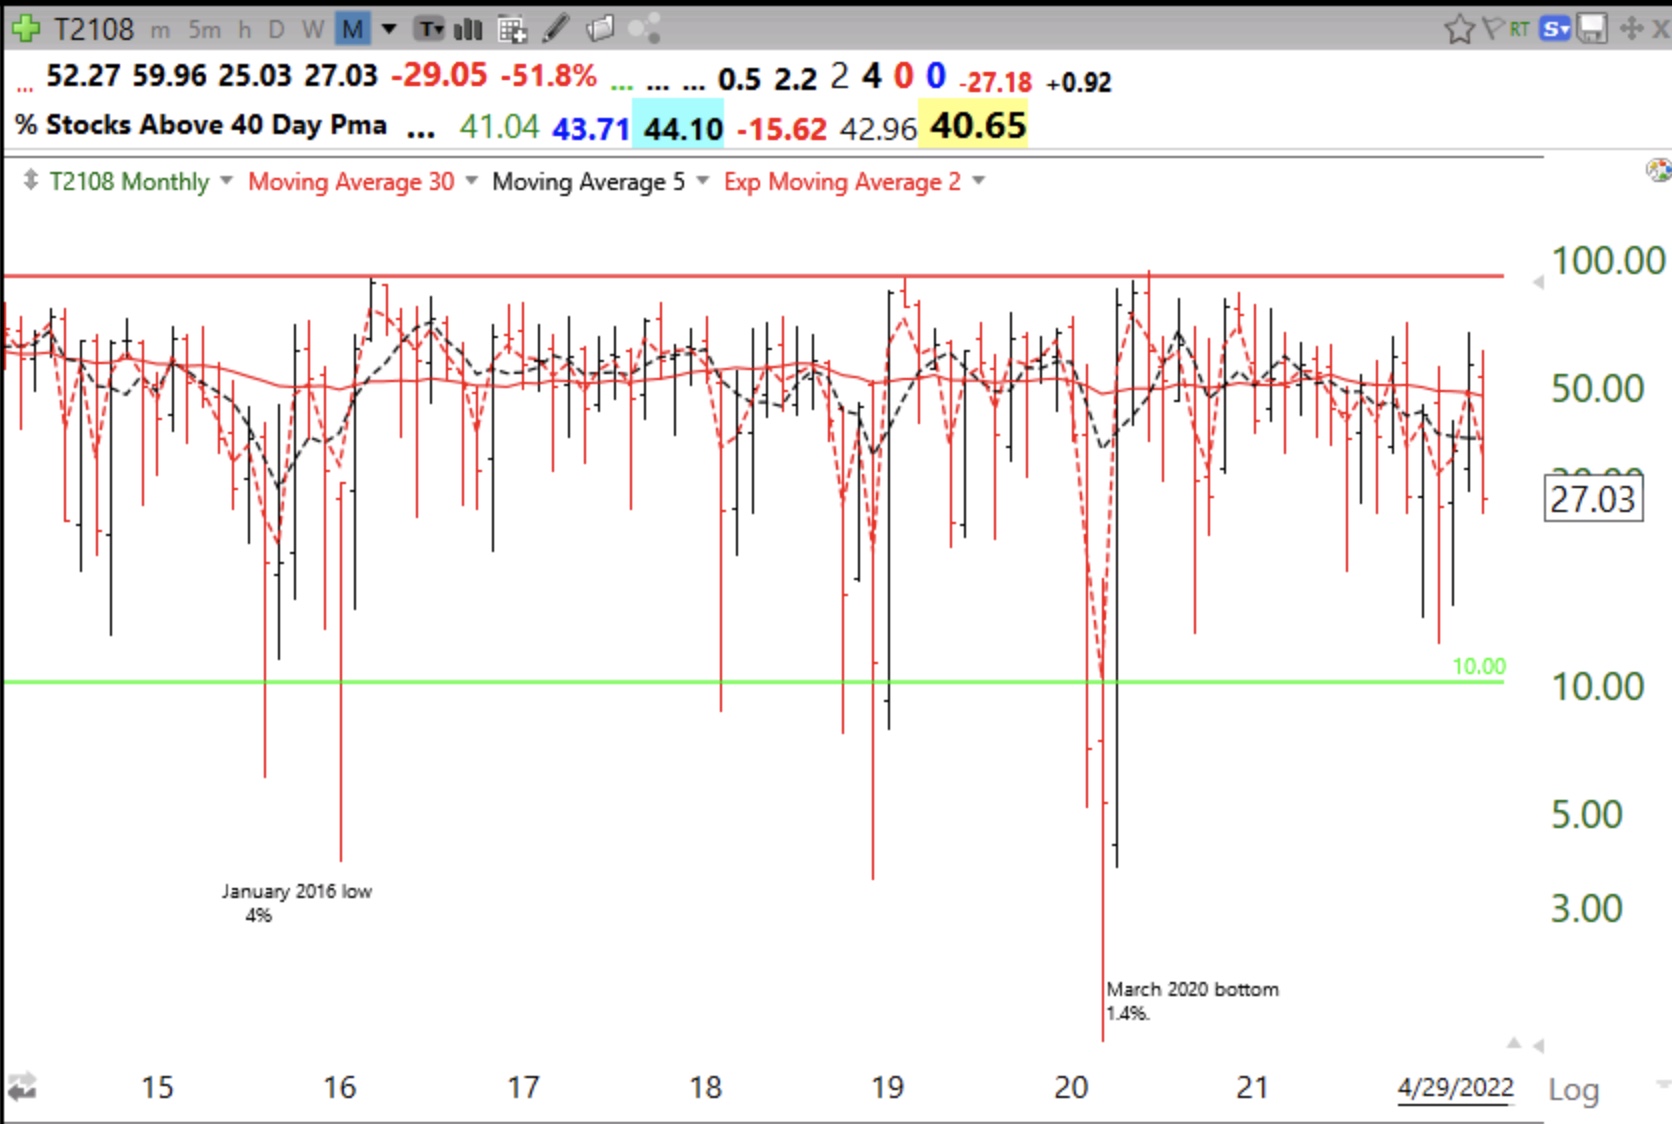
Finally, my best objective indicator of an oversold market, T2108, is far from oversold. When it reaches below 10% most people will be scared of something, last time it was the pandemic, and it will make sense for me to hold my nose and buy just a little SPY, not individual stocks, and accumulate it only on the way up after a bottom appears to be in place. Here is the monthly chart of T2108, currently at 27%.
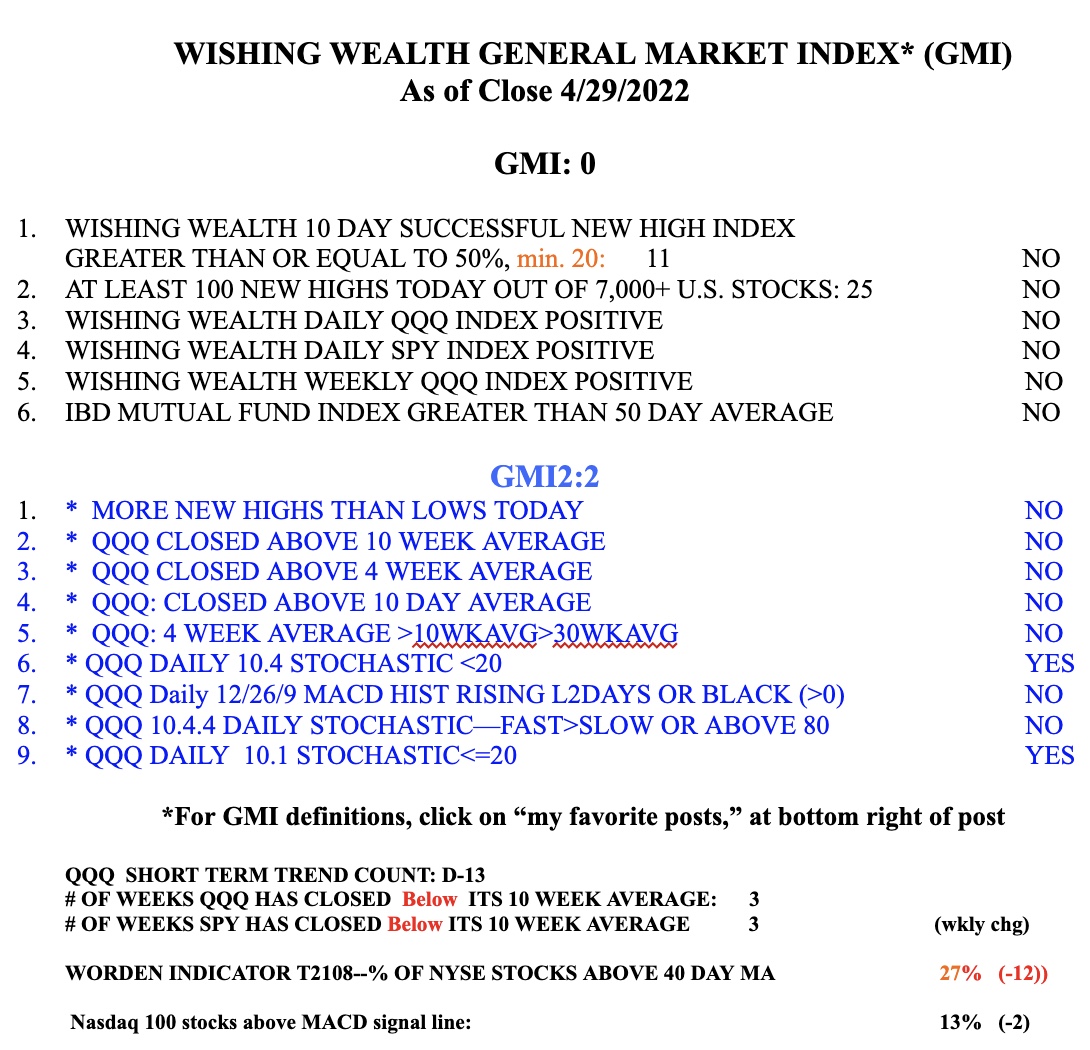
I have also learned not to buy stocks when my GMI signal is Red, and especially when it is zero. The GMI turns Red when it declines below 3 for two consecutive days and turns Green when it closes above 3 for two consecutive days. I am glad I am in cash, and have empathy for those who are being harmed by the current decline. However, it is best not to become too attached to a market scenario. If my indicators should reverse, I will too.